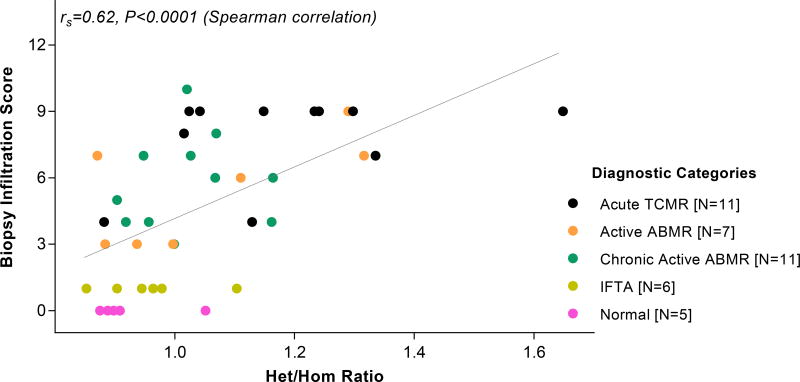
Figure 5. Association between the Het/Hom ratio and the biopsy infiltration score of the 40 allograft biopsies.
Banff acute scores include the “t” [tubulitis] score, “i” [interstitial inflammation] score, “g” [glomerulitis] score, “ptc” [peritubular capillary inflammation] score and “v” [vascular inflammation] score. Each score ranges from 0 through 3. For each kidney allograft biopsy, we summed all the Banff acute scores and created a single numerical value, called the biopsy infiltration score, that ranges from 0 to 15. This figure depicts the infiltration score on the y-axis and Het/Hom ratio on the x-axis, for the 40 kidney allograft biopsy samples. The association between the Het/Hom ratio and the biopsy infiltration score was statistically significant (r=0.62, P<0.0001, Spearman rank-order correlation).

