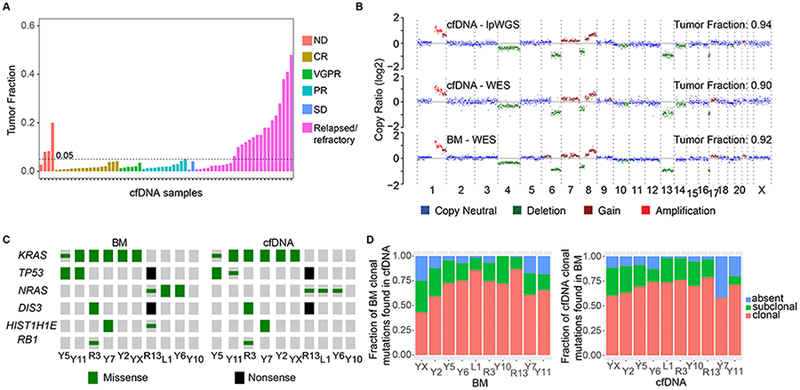
Figure 1. Concordance of clonal genomic landscape in cfDNA and BM-derived Myeloma.

(A) Tumor fractions estimated by lpWGS of cfDNA from 67 patients (out of 93 patients) for whom clinical information was available. ND, newly diagnosed; CR, complete response; VGPR, very good partial response; PR, partial response; SD, stable disease. (B) Copy number profiles and tumor fraction estimated by lpWGS or WES of cfDNA and WES of BM MM from a patient. (C) Distribution of MM putative driver somatic mutations from WES of BM-derived myeloma and matched cfDNA samples. (Clonal = large symbols, subclonal = small symbols). (D) Left panel: Fraction of clonal mutations in BM-derived myeloma of ten MM patients that were also identified in matched cfDNA, either as clonal (red), as subclonal (green) or not detected (blue). Right panel: Fraction of clonal mutations detected in cfDNA that were also identified in the matched BM-derived myeloma.
