

Abstract
The anticancer effects of combined gemcitabine and birinapant were demonstrated as synergistic in PANC-1 cells in vitro. In this study, pharmacokinetic information derived from experiments and the literature was utilized to develop full physiologically-based pharmacokinetic (PBPK) models that characterize individual drugs. The predicted intra-tumor drug concentrations were used as the driving force within a linked PBPK/PD model for treatment-mediated changes in tumor volume in a xenograft mouse model. The efficacy of the drug combination in vivo was evaluated mathematically as exhibiting additivity. The network model developed for drug effects in the in vitro cell cultures was applied successfully to link the in vivo tumor drug concentrations with tumor growth inhibition, incorporating more mechanistic features and accounting for disparate drug interaction outcomes in vitro and in vivo.
Keywords: Physiologically-based pharmacokinetic model, pharmacodynamics, gemcitabine, birinapant, drug combination, pancreatic cancer xenografts
Introduction
Pancreatic cancer is the fourth leading cause of cancer-related deaths in the United States and is characterized by low survival rates and high drug resistance [1]. Numerous efforts have sought to identify efficacious drug combinations for treatment of pancreatic cancer. Preclinical systems are important tools for assessment of novel drug combinations and understanding mechanisms of drug action and interactions.
Gemcitabine (2’,2’-difluoro-2’-deoxycytidine (dFdC); Gemzar) is a cytidine analog that has clinical activity in a wide variety of solid tumors, including pancreatic, ovarian, breast, and non-smalls-cell lung cancers. The main dose-limiting toxicity of gemcitabine is myelosuppression [2]. The uptake of gemcitabine into cells is via nucleoside transporters (SLC28/29), and it is phosphorylated intracellularly by deoxycytidine kinase into its active diphosphate (dFdCDP) and triphosphate (dFdCTP) forms. The metabolites dFdCDP inhibits ribonucleotide reductases, whereas dFdCTP competes with the natural substrate dCTP for incorporation into DNA, resulting in inhibition of DNA synthesis [3, 4]. Gemcitabine is administered by intravenous infusion. The volume of distribution increases with infusion duration, from 50 L/m2 to 370 L/m2, and plasma protein binding is negligible [2]. Gemcitabine is extensively metabolized to 2’,2’- difluoro-2’-deoxyuridine (dFdU) by cytidine deaminase (CDA), followed by urinary excretion [2]. The plasma half-life is about 30 min and this short half-life is the result of extensive CDA expression in liver and other tissues, as well as rapid tissue distribution [5, 6].
Birinapant (TL32711) is a bivalent second mitochondria-derived activator of caspase (SMAC) mimetic or Inhibitor of Apoptosis Proteins (IAP) antagonist. It is currently being tested clinically in combination with pembrolizumab for solid tumors and with carboplatin for ovarian, fallopian tube, and primary peritoneal cancers. Birinapant binds with high affinity to several IAPs, including XIAP and cIAP1,2, and rapidly degrades TRAF2-bound cIAP1,2, thereby inhibiting TNF-mediated NF-kB activation. In addition, birinapant promotes the activation of caspases. Birinapant has shown synergistic cytotoxicity with several widely used chemotherapeutic agents in preclinical studies [7]. Compounds from the SMAC mimetic drug class exhibit similar pharmacokinetic features, which include dose-linear exposure, moderate plasma half-life, and extensive distribution in tissues [8–11]. In a phase I clinical trial, birinapant was administered by intravenous infusion and the plasma concentration profile showed a tri-exponential decline, with an estimated terminal half-life of 19–47 h. The volume of distribution was high (~710.4 L), indicating extensive tissue uptake, and the urinary excretion was low [12].
In previous cell culture studies, the efficacy of combined gemcitabine and birinapant was determined as synergistic in PANC-1 cells [13], and a systems network model was developed to characterize quantitatively the mechanisms of drug action upon several biological signaling pathways [14, 15]. In this study, the efficacy of this drug combination was evaluated in xenograft animal models, and mechanistic modeling of drug interaction pathways was further incorporated to elucidate the events between dosing and efficacy. Characterization of drug distribution at the site of action (e.g. tumor) is another important step in evaluating tumor growth inhibition and for translating between in vitro and in vivo research. Therefore, PBPK and network modeling approaches, based on experimental studies and information gathered from the literature, were utilized to characterize drug concentrations in plasma and tumor, and effects on tumor growth.
Materials and Methods
Data Sources
The data sources used to characterize the pharmacokinetics (PK) of gemcitabine (dFdC) and its metabolite dFdU are summarized in Table S-1 [5, 6, 16, 17]. Concentration vs. time profiles in plasma and tissues were available for doses of 0.1, 20, 30, 160 mg/kg in mice. Distribution partition coefficients (Kp) values were calculated from the ratio of the AUC in tissue to the AUC in plasma for tissues for which concentration profiles were not available [5].
Concentration vs. time profiles of birinapant in plasma, tumor (MDA-MB-231 xenografts), liver, kidney, lung, heart, brain, and intestine were obtained from a published poster [18] for a single intravenous (IV) bolus dose in mice (5 mg/kg). Birinapant concentrations in tumor and liver of mice bearing patient-derived pancreatic cancer xenograft tumors were also obtained from a published poster [19]. Drug concentrations in tissues were converted from ng/g to ng/ml by assuming a tissue density of 1 g/ml.
Study design for tumor growth in vivo
In vivo studies were performed by Tetralogic Pharmaceuticals Inc. PANC-1, a pancreatic cancer cell line originating from a 56 year-old Caucasian male, was cultured in Dulbecco’s Modified Eagle’s Medium (DMEM; Cellgro) supplemented with 10% (v/v) fetal bovine serum (FBS; Atlanta Biologicals). Female athymic nu/nu mice (Harlan Sprague-Dawley) weighing approximately 20–24 g were injected subcutaneously in the flank with 1×10⁷ cells suspended in 200 μl of a solution containing 1:1 Hank’s buffered saline to Matrigel. When tumors reached approximately 150 mm3, animals were randomized by tumor volume into groups of 10 mice each, and dosing was initiated (Day 0). Tumor dimensions were measured at least twice weekly by digital caliper (Fowler Ultra-Cal IV, Newton, MA). Tumor volumes were calculated using the formula: TV = width2 × length × 0.52.
Birinapant was administered by intraperitoneal (IP) injection at 6, 20, or 60 mg/kg in 12.5% Captisol in sterile water (pH~4) once every 3 days for 10 total treatments (q3d×10). A vehicle control group received Captisol without drug using the same dosing schedule. Gemcitabine was administered IP at 40 mg/kg once every 3 days for 4 doses beginning on Day 0, and the cycle was repeated on day 15 (q3d×4×2). The drug combination group received 20 mg/kg birinapant (q3d×10) and 40 mg/kg gemcitabine (q3d×4×2).
Physiologically-based pharmacokinetic (PBPK) models
The workflow of model development is depicted in Figure 1. Physiologic parameters were obtained from the literature (Table 1) [20–22]. Mass balance was maintained throughout the system. Both drugs are rapidly absorbed after IP injection, and in-house data showed that the bioavailability of birinapant by IP injection is close to 100% (data not shown). Plasma protein binding, which is negligible for gemcitabine [5], was not considered.
Figure 1.
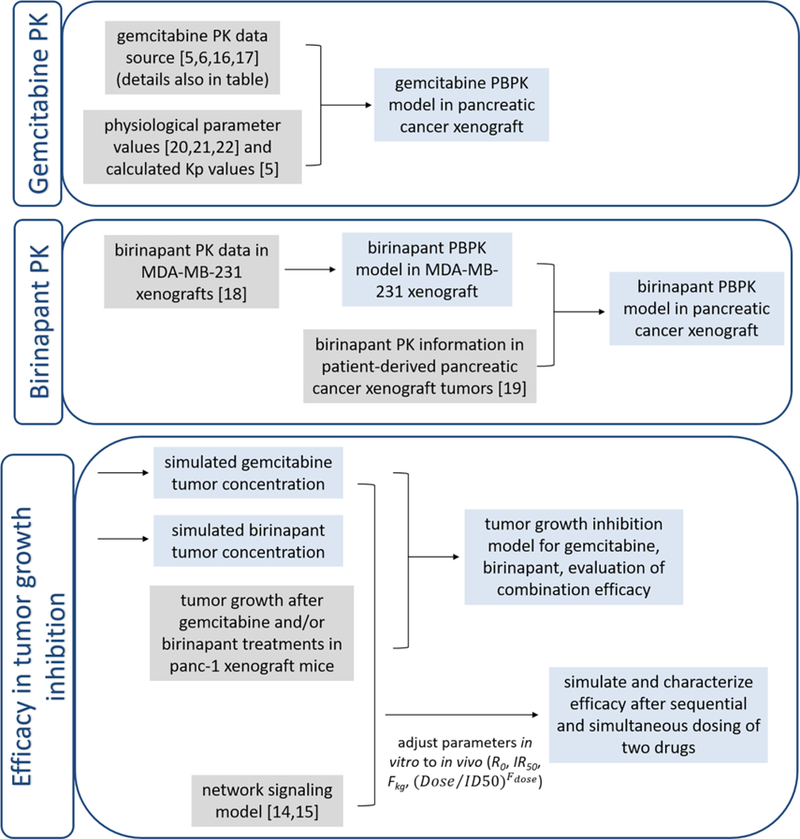
Workflow of PBPK and PK model development. Gray box indicates data source for the model inputs, and blue box indicates model outputs.
Table 1.
Typical physiological parameter values for 25 g mice.

|
The PBPK model schematic for birinapant is presented in Figure 2. The model includes 9 compartments, blood (pla), lung (lug), tumor (tum), intestine (int), liver (liv), kidney (kid), heart (hrt), brain (bra), and the carcass remainder (res), linked by blood flow (Q). The concentrations in plasma and lung were described as:
| (1) |
| (2) |
Elimination of the drug was assumed to occur in the liver and was modeled as a linear process with a clearance of CLliv, and the concentrations in liver was described as:
| (3) |
Figure 2.

Whole body PBPK model for birinapant in mice. Organs are represented by rectangles and interconnected via blood flows Q. Symbols are defined in Table 2.
Drug distribution in intestine was assumed to occur instantaneously and homogenously, and therefore perfusion-limited models were used to describe tissue concentrations:
| (4) |
In other organs (tumor, kidney, heart, brain, and carcass), diffusion-limited models were:
| (5) |
| (6) |
| (7) |
where Qtissue is the organ blood flow rate, Vtissue is organ volume, Ctissue,vs is the concentration in tissue vascular space, Ctissue,evs is the concentration in tissue extravascular space, Ftissue,vs is the fraction of vascular space volume, Kptissue is the partition coefficient, and PStissue is the permeability surface area product.
The PBPK model schematic for gemcitabine is presented in Figure 3. The model includes 11 compartments for the parent drug (dFdC): blood, lung, heart, tumor, intestine, pancreas (pan), spleen (spl), liver, kidney, bone marrow (bom), and the carcass remainder.
Figure 3.

Whole body PBPK model for gemcitabine (dFdC) and its metabolite (dFdU) in mice. The interpretation of symbols and labels is the same as in Figure 1. Symbols are defined in Table 3.
The concentrations in plasma and lung were described in the same format as in Eq. 1 and 2. Well-stirred perfusion-limited models were applied to tumor, intestine, pancreas, heart, and bone marrow because of the similar Tmax and terminal half-lives in these organs compared to plasma. Diffusion-limited conditions were assumed for spleen and carcass.
The concentrations of dFdC in the liver and kidney were described as:
| (8) |
| (9) |
The model also includes 5 compartments for the major metabolite dFdU: blood, lung, liver, kidney and the carcass remainder. The parent drug dFdC is metabolized to dFdU mainly in liver and kidney, and dFdU is subsequently excreted by the kidney.
The concentrations of dFdU in liver and kidney were described as:
| (10) |
| (11) |
Pharmacodynamic (PD) model
The unperturbed growth of tumor was described with an exponential function:
| (12) |
where kng is the first-order rate constant of net tumor growth, and TV0 is the tumor volume when dosing was started.
The inhibitory effect of birinapant on tumor growth was described with a nonlinear function:
| (13) |
and that of gemcitabine with a linear function:
| (14) |
where Kmaxb is the maximal cell killing effect from birinapant, KC50b is the birinapant concentration in tumor required for half maximum effect; and Killg is the first-order rate constant for killing caused by gemcitabine.
In the combination group, the interaction term Ψ was multiplied with either KC50b (Eq. 15) or Killg (Eq. 16) to test the possibility of synergism, additivity, or antagonism of the two drugs.
| (15) |
| (16) |
When Ψ was multiplied with KC50b, Ψ<1 represents synergism, Ψ=1 additivity, and Ψ > antagonism; when Ψ was multiplied with Killg, the interpretations of Ψ are the opposite.
Implementation of network model to link PK and PD
A previously-developed network model describing drug-mediated changes observed in vitro at the proteomic level [13, 14] was used to link the drug concentrations in tumor and tumor growth to incorporate mechanistic features. Several parameters were modified to reconcile the differences between in vitro and in vivo systems (model schematic in Figure S-1 and model code in Supplementary Material). The parameters R0 (the initial tumor size), and IR50 (the growth restriction on proliferating cells), were adjusted to account for the differences of tumor cell growth rate in vivo vs. in vitro. A fractional parameter Fkg was multiplied with the rate constants k1 (transition from G0/G1 to S cell-cycle phases), k2 (transition from S to G2/M phases), k3 (transition from G2/M to G0/G1 phases), kapo (rate from proliferating to apoptotic death), and kother (rate from proliferating to non-apoptotic death). Factor(Dose/Fdose) was applied to modify the apoptosis signaling induced by birinapant to account for dose-dependent tumor inhibitory effects. These parameters were calibrated so that the tumor growth profiles were captured well for the different doses of birinapant and gemcitabine, alone and in combination. The drug concentration units were also converted from those in the xenograft study (ng/ml) to those in the cell culture study (nM).
Prediction of Kp values
The Rodgers et al method for moderate and strong bases was used to calculate Kp values of birinapant distribution in different tissues from in silico data [23]. The pKa of birinapant was estimated using JChem (https://epoch.uky.edu/ace/public/pKa.jsp), and the logKOWWIN value was predicted using EPIWEB 4.1 (US Environmental Protection Agency, Washington DC). Compounds from the same drug class as birinapant, such as AT-406 and GDC-0512, share similar properties of plasma protein binding and blood/plasma partitioning, and therefore the fup and Kb/p values of birinapant were assumed to be similar to AT-406 [24, 25]. All other system-related distribution parameters were obtained from the literature [23].
Data analysis
Model fitting and parameter estimation was performed using ADAPT 5 with the maximum likelihood algorithm [26]. Naïve-pooled data from all replicate studies were analyzed using the variance model:
| (18) |
where Vi is the variance of the response at the ith time point (ti), and Y(ti) is the predicted response at time ti. The variance parameters intercept and slope were estimated together with system parameters. Model performance was evaluated by goodness-of-fit criteria, including visual inspection of the fitted curves, sum of squared residuals, Akaike Information Criteria (AIC), Schwarz Criterion (SC), and Coefficients of Variation (CV%) of the estimated parameters.
Results
PBPK model for birinapant
The concentration profiles of birinapant in plasma, tumor (MDA-MB-231 xenografts), and six other tissues after IV injection of 5 mg/kg are presented in Figure 4. Linear pharmacokinetics were assumed based on information provided in a published poster [27]. Birinapant was assumed to be eliminated mainly by the liver, similar to drugs of the same class [25]. Based on this information, a PBPK model for birinapant was developed (Figure 2). The terminal half-life was about 20 h in plasma and 40–200 h in tissues, indicating slow drug loss from tissues. Therefore, diffusion/permeability-limited distribution models were applied to the major organs, and favorable PK features resulting in appreciable concentrations in tumor could be presumed. The concentration profiles were captured well by the PBPK model (Figure 4), and the parameters, estimated with reasonable CV%, are summarized in Table 2. Additional model goodness-of-fit plots are provided in Supplementary File 2. The estimated hepatic intrinsic clearance was 105 ml/h, and accounting for the hepatic blood flow of 135 ml/h, the apparent clearance calculated from is about 60 ml/h. If converted to a 75 kg human using allometric scaling with a coefficient factor of 0.75, the estimated clearance would be about 24 L/h, which matches the reported value from human studies [28]. The estimated partition coefficients values (Kp) for most tissues are large (10–200), except for brain (<2), consistent with the characteristic of extensive tissue distribution for this drug class. Desmoplastic stroma and inadequate vasculature in pancreatic cancer lead to relatively lower tumor distribution in pancreatic cancer xenografts compared to breast cancer xenografts [29], and a correlation of liver and tumor concentrations (Figure S-2) indicated concentrations about 20-fold lower in pancreatic cancers than in liver [19]. Therefore, the Kp value for tumor tissue in the pancreatic cancer xenografts was calibrated to 2.0, so that tumor concentrations 20-fold lower than in liver were predicted (Figure 4).
Figure 4.

Plasma and tissue concentration-time profiles of birinapant following an IV bolus dose of 5 mg/kg in tumor-bearing mice. The solid circles are digitized observations from [18], the solid black lines are model-fitted profiles for MDA-MB-231 xenografts, and the red dashed lines are model simulations for concentration profiles in mice with PANC-1 pancreatic cancer xenografts.
Table 2.
Parameter estimates for birinapant pharmacokinetics. Kptissue is the partition coefficient, PStissue is the permeability surface area product, and CLliver reflects the hepatic clearance.

|
The model-estimated tissue Kp values were compared with the Kp values predicted with the Rodgers et al method for strong bases [23]. Physicochemical parameters of birinapant required for Kp prediction were calculated: the pKa using JChem was 12.6, and the logKOWWIN was 2.43. Based on these values, the Rodgers et al method [23] predicted Kp values that are about 10-fold lower than the model-estimated values for tissues other than the heart and brain (Table 2).
PBPK model for gemcitabine
Over a range of doses (0.1–160 mg/kg), the plasma concentrations of the parent drug gemcitabine (dFdC) indicated linear PK (Figure 5). More than 90% of gemcitabine was recovered in urine, mainly as the dFdU metabolite, and protein binding of gemcitabine is negligible [5]. Concentration profiles of dFdC in pancreatic xenograft tumors, bone marrow, and spleen were obtained from literature (Figure 5). For the other tissues for which full concentration profiles were not available, such as lung, heart, intestine, pancreas, liver, and kidney, the reported tissue Tmax and terminal half-lives were similar to those of plasma [5], and therefore well-stirred and perfusion-limited distribution was assumed for these tissues. Because of the extensive expression of CDA (the major metabolizing enzyme for dFdC) in liver and kidney of mice, and the high Km value (the dFdC concentration required for half-maximal saturation of the CDA enzyme) [30], linear elimination of dFdC and conversion to dFdU in liver and kidney were assumed. A PBPK model characterizing both dFdC and dFdU was developed based on this information (Figure 3). Concentrations of dFdC and dFdU were well characterized by the model (Figure 5) with reasonable parameter estimates (Table 3). The apparent hepatic clearance is estimated as 12.4 ml/h and renal clearance as 2.9 ml/h using the previous equation, and the estimated total clearance is 15.3 ml/h. The higher clearance in liver compared to kidney is consistent with greater expression of CDA in liver [31]. The Kp values were 0.137 in tumor and 0.498 in bone marrow, indicating limited drug distribution into the site of action and slightly higher distribution into the major site of toxicity.
Figure 5.

Plasma and tissue concentration-time profiles of gemcitabine (dFdC) and its metabolite (dFdU) following IV bolus doses of 0.1, 20, 30, and 160 mg/kg in mice. Symbols are digitized observations and lines depict model-fitted profiles. Data sources for observations are summarized in Table S-1 [5, 6, 16, 17].
Table 3.
Parameter estimates for gemcitabine pharmacokinetics. Kptissue is the partition coefficient, PStissue is the permeability surface area product, CLliver reflects the hepatic clearance of dFdC, CLkidney reflects the renal clearance of dFdC, and CLdFdU,kidney reflects the renal clearance of dFdU.

|
Tumor growth analysis
Unperturbed tumor growth was best fitted with an exponential function. The inhibitory effect of birinapant on tumor growth was described with a nonlinear function because of available information for a range of dosages, whereas the inhibitory effect of gemcitabine was described with a linear function. To achieve more accurate estimation of the drug interaction term Ψ, the control group and the single-agent treatment groups were modeled simultaneously (Eq. 12–14). Next, the parameters for tumor growth and single drug efficacy were fixed, and the interaction term Ψ was estimated to characterize tumor growth for the drug combination (Eq. 15,16). The tumor growth profiles were well described with this sequential model-fitting strategy (Figure 6) and the parameters were estimated with reasonable values and CV% (Table 4).
Figure 6.

Observed and model-fitted tumor growth profiles for control and treatment groups in tumor-bearing mice. Gemcitabine was administered at 40 mg/kg once every three days for four doses, and the cycle was repeated beginning on Day 15 (q3d×4×2); Birinapant was administered alone at 6, 20 or 60 mg/kg on a q3d×10 schedule, or at 20 mg/kg on a q3d×10 schedule in combination with 40 mg/kg gemcitabine on a q3dx4×2 schedule. Symbols are measured values (mean± SD, n=10) and the lines are model-fitted profiles.
Table 4.
Pharmacodynamic parameter estimates for tumor growth.

|
The PANC-1 cell line was used for both the in vivo tumor growth study and our previous cell culture studies [13, 14]. Therefore, the parameters obtained from the two systems were compared. The estimated rate of net tumor growth in vivo (kng) was 0.00571 h−1, corresponding to a doubling time of 5 days. This rate is much smaller than the net cell growth rate in vitro (kg - kd), which was about 0.02 h−1 [13]. Comparing the in vivo and in vitro efficacy of birinapant, the maximal rate of cell killing (Kmaxb) in vivo, was 0.0167 h−1; whereas Kmaxb in vitro, calculated from (Imax·kg) or (Smax·kd), was around 0.007 h−1. The KC50b was 2.90 × 10³ ng/ml (3.60 × 10³ nM) in vivo, whereas IC50 or SC50 was around 150 nM in vitro. These indicate that PANC-1 cells are about 20-fold more sensitive to birinapant in vitro than in vivo. The rate of cell killing induced by gemcitabine (Killg) was 2.76 × 10⁻⁵ h−1 in vivo, and the corresponding in vitro parameter, calculated from (Imax·kg/IC50), was 0.001 h−1. Therefore, PANC-1 cells are 30-fold more sensitive to gemcitabine in vitro than in vivo. The interaction term Ψ in vivo was estimated with good accuracy: when Ψ was multiplied with KC50b, the estimated Ψ was 1.27; when Ψ was multiplied with Killg, the estimated Ψ was 0.944 (Table 4). Neither Ψ value was significantly different from 1, which indicates additive effects of the drugs on tumor growth inhibition in vivo. In contrast, the estimated Ψ value in vitro was about 0.6, indicating synergism [13].
Bridging PK and tumor growth with a mechanistic network model
The mechanisms of action and interaction of gemcitabine and birinapant have been characterized previously using a systems network model based on cell culture data [14, 15]. Signaling pathways of cell cycle progression, DNA Damage Responses, MAPK, NF-κB, and apoptosis were described quantitatively to drive changes in cell cycle progression and apoptosis, and were linked to changes in cell number. Because the same cell line was used as a xenograft model, the previously-developed network model [14] was applied to link tumor drug concentrations to tumor growth. More specifically, tumor concentrations were used to drive changes in network signaling that, in turn, led to changes in tumor volume. Several parameters were calibrated to account for the different growth rates and sensitivities to drug in vitro and in vivo, so that the tumor growth profiles for the vehicle control and different doses of gemcitabine and birinapant, alone and in combination, were all reasonably captured (Figure 7a left). The initial tumor size R0 was calibrated to 150 mm3, the fractional parameter on growth and apoptosis rate Fkg was set to 0.15, and IR50 was 1500 mm3, so that the control tumor growth was captured well. The parameter for birinapant dose-dependenct effect in apoptosis induction Fdose was calibrated to 50 mg/kg, so that the tumor growth profiles at different doses of birinapant were also well-captured. The combined effects of birinapant at 20 mg/kg and gemcitabine at 40 mg/kg were then simulated. The predicted tumor growth profile matched the experimental data well, supporting the use of the network model, with these calibrated parameters, for linking PK and PD in vivo.
Figure 7.

Prediction using the network model to link the PBPK and PD models. The same dosing schedule as in Figure 6 was applied. (a) Model-predicted tumor growth profiles for control and treatment groups in tumor-bearing mice. Signaling for gemcitabine-induced apoptosis (b) and DNA repair (c) when gemcitabine and birinapant were dosed either simultaneously or sequentially with birinapant dosed 24 h after gemcitabine.
The network model can incorporate mechanistic features and provide additional insights into drug combination effects. For example, tumor growth profiles were simulated for both simultaneous and sequential dosing, motivated by in vitro studies that showed enhanced efficacy when birinapant exposure was delayed 24 h after initiating gemcitabine treatment [13]. Model simulations predicted that simultaneous dosing would be slightly more effective than sequential dosing in terms of overall tumor progression in vivo (Figure 7a right), in contrast to the in vitro results. Several major response signaling pathways were also simulated for the two dosing schedules. Similar apoptotic signaling was achieved with both dosing schedules (Figure 7b). However, the DNA repair response, which is induced by gemcitabine and contributes to cell survival, was stronger with sequential dosing (Figure 7c), and this may account for the different model-predicted efficacy in vivo compared to in vitro. Delayed exposure to birinapant was hypothesized to prolong the delay of DNA repair in vitro [13]. However, gemcitabine concentrations in tumor (100–1000 nM) were much higher than the concentrations in vitro (< 20 nM), and after an initial delay in onset, DNA repair signaling would be constantly activated in vivo. Therefore, although delayed birinapant dosing may initially mediate stronger suppression of DNA repair signaling, at later time points the effect may not be as strong as with simultaneous dosing (Figure 7c).
Discussion
In this study, pharmacokinetic information was gathered from the literature and experimental sources, and full-PBPK models were developed to characterize the PK features of birinapant and gemcitabine. Gemcitabine has been the first-line treatment for pancreatic cancer for years, but its PK has not been thoroughly described quantitatively. Here, gemcitabine distribution to sites of both action (tumor) and toxicity (bone marrow) was well characterized, and potentially could be linked to evaluation of toxicity. The relationship between plasma and tumor concentrations was derived for both drugs. Plasma and pancreatic tumor concentrations of birinapant were comparable, whereas gemcitabine concentrations were about 10-fold lower in tumors compared to plasma. In clinical trials, the plasma concentrations of birinapant attained were 100–1000 ng/ml [28], whereas gemcitabine plasma concentrations were found to exceed 10 μg/ml [32–34]. Therefore, the selected doses and the developed PK models have clinical relevance for drug exposures.
The estimated Kp values of birinapant in tissues other than brain or pancreatic cancer xenografts were 10–200, indicating extensive tissue accumulation of birinapant. However, the Kp values predicted using the Rodgers et al method [23] were all smaller than 15. Although this calculation method considers drug ionization and binding to different lipids and phospholipids, the predictions for birinapant were low. The large discrepancy is arguably the result of either specific binding of birinapant to its target IAP proteins or lysosomal trapping, which affects strongly lipophilic basic drugs significantly [35].
The data characterization and estimated parameters of the PBPK model were also compared to compartmental models (Figure S-3, S-4). The estimated central (V1) and peripheral volumes of distribution (V2) for birinapant are much larger than those for gemcitabine, consistent with the large Kp values for birinapant. With compartmental modeling, the terminal plasma concentrations for birinapant were characterized better and the estimated clearance is higher (90 ml/h). However, the estimated clearance using the PBPK model is more consistent with that observed in humans. Theoretically the terminal phase in plasma and other tissues should be parallel. However, the observed late phase in plasma is faster than in other tissues. It is possible that the true terminal phase in plasma was not captured because of the lower limit of quantification or insufficient sampling. Therefore, with PBPK modeling, distribution between plasma and other tissues may provide better characterization of true terminal elimination. For gemcitabine, the terminal plasma phase was also captured better with compartmental modeling, and the estimated terminal elimination rate (1.4 h−1) is much faster than that based on PBPK modeling (0.61 h−1). The same reasoning as for birinapant may apply. The evidence in support is that if the last concentration value was removed and data re-fitted with compartmental modeling, the estimated slope (0.96 h−1) is closer to that obtained by PBPK modeling (Figure S-5). It is also possible that current assumptions regarding gemcitabine elimination are inadequate. It was assumed that CDA expression is mainly in liver and kidney, and gemcitabine is eliminated by conversion to dFdU with a linear conversion rate. However, other elimination pathways may exist.
Comparing the estimated parameters obtained from in vitro and in vivo PD models that employ the same cancer cells, the cells grow faster and are more drug-sensitive in vitro. These factors must be considered when pursuing in vitro-to-in vivo translational research. Based on the semi-mechanistic PBPK/PD model, the estimated drug interaction term Ψ, whether multiplied with KC50b or Killg, was not significantly different from 1, indicating additive effects of the two drugs in vivo. However, this drug combination was synergistic in vitro using the same cell line [13]. Reasons for this difference were explored by incorporating additional mechanistic features. The network model was used to link the tumor concentrations and tumor growth, but several parameters required calibration to capture the tumor growth profiles for different birinapant doses, the single gemcitabine dose, and the combination. A dose- dependent factor, (Dose/Fdose), was incorporated into the birinapant-induced apoptosis signaling in order to account for the dose-dependent tumor inhibitory effects, and Fdose was calibrated to be 50 mg/kg. Therefore, this correction factor was less than 1 at the dose of 20 mg/kg used in the combination, representing weaker apoptosis signaling at this in vivo dose compared to cell culture studies. This model behavior may partially account for the observed disparity in overall efficacy of the drug combination in vivo vs. in vitro, and a larger range of doses for the combination in vivo could provide better characterization of drug interactions. A similar disparity in in vitro vs. in vivo drug efficacy has been reported for preclinical studies of the histone deacetylase inhibitor belinostat in pancreatic cancer [36]. Other factors that may also impact in vitro-to-in vivo translation of drug efficacy include the heterogeneity of cells in tumor tissue [37], as well as the influence of the stromal cells and extracellular matrix [38].
The protein binding of birinapant was not included in the model for lack of data. However, the distribution coefficient Kp was estimated, and therefore differences between tissue and plasma protein binding were partially accounted for. In addition, PK interactions of the drugs were not explored in the in vivo study. A clinical study found that gemcitabine increased the efflux rate of birinapant from fast-distribution tissues to plasma (parameter k31 in a compartmental model) by 30%, possibly because of reduced OATP1B3-mediated tissue uptake [28]. The impact of gemcitabine on birinapant PK was considered as minor, and PK interactions were not considered here, because the final PK model structures for combined birinapant and gemcitabine were the same as for the single agents [28], and birinapant exhibited high concentrations in most tissues. Finally, the strategy here to translate the network model from in vitro to in vivo is empirical and specific to these two drugs. However, the overall approach may serve as a prototype for the evaluation of other drug combinations.
A Monte Carlo simulation of the drug effects was applied to address possible variation of parameters in altering the PD outputs. In our previous application of the network model to the effects of gemcitabine, a sensitivity analysis was carried out. We evaluated the network model with perturbation of key model parameters by both drugs and the outcome remained quite similar as reported[15]. Key PD outputs simulated with variability in the most sensitive parameters were presented in Figure S-6.
In conclusion, this study gathered literature and experimental information to develop full-PBPK models that characterize drug PK in sites of both action and toxicity. Drug efficacy in tumor growth inhibition in vivo was evaluated based on a semi-mechanistic PBPK/PD model. By bridging PK and PD with network signaling, we can interpret the observed results and evaluate drug combinations for other dosing schedules.
Supplementary Material
Acknowledgements
This work was supported by National Institutes of Health grants R01 GM24211 to WJJ and R01 CA198096 to RMS. We thank Tetralogic Pharmaceuticals Inc. for sharing the information for the tumor growth study.
Footnotes
Conflict of Interest/Disclosure
The authors declared no conflict of interest.
Contributor Information
Xu Zhu, Department of Pharmaceutical Sciences, University at Buffalo, The State University of New York.
Sheryl Trueman, Department of Pharmaceutical Sciences, University at Buffalo, The State University of New York.
Robert M. Straubinger, Department of Pharmaceutical Sciences, University at Buffalo, The State University of New York
William J. Jusko, Department of Pharmaceutical Sciences, University at Buffalo, The State University of New York.
References
- 1.Siegel RL, Miller KD, Jemal A (2016) Cancer statistics, 2016. CA Cancer J Clin 66:7–30. 10.3322/caac.21332 [DOI] [PubMed] [Google Scholar]
- 2.Eli Lilly and Company, Indianapolis I (1996) GEMZAR [package insert].
- 3.Morgan MA, Parsels LA, Parsels JD, Mesiwala AK, Maybaum J, Lawrence TS (2005) Role of checkpoint kinase 1 in preventing premature mitosis in response to gemcitabine. Cancer Res 65:6835–42. 10.1158/0008-5472.CAN-04-2246 [DOI] [PubMed] [Google Scholar]
- 4.Wong A, Soo RA, Yong W-P, Innocenti F (2009) Clinical pharmacology and pharmacogenetics of gemcitabine. Drug Metab Rev 41:77–88. 10.1080/03602530902741828 [DOI] [PubMed] [Google Scholar]
- 5.Shipley LA, Brown TJ, Cornpropst JD, Hamilton M, Daniels WD, Culp HW (2006) Metabolism and disposition of gemcitabine, and oncolytic deoxycytidine analog, in mice, rats, and dogs. Drug Metab Dispos 20:849–55. [PubMed] [Google Scholar]
- 6.Veltkamp SA, Pluim D, van Tellingen O, Beijnen JH, Schellens JHM (2008) Extensive metabolism and hepatic accumulation of gemcitabine after multiple oral and intravenous administration in mice. Drug Metab Dispos 36:1606–15. 10.1124/dmd.108.021048 [DOI] [PubMed] [Google Scholar]
- 7.Benetatos CA, Mitsuuchi Y, Burns JM, Neiman EM, Condon SM, Yu G, Seipel ME, Kapoor GS, Laporte MG, Rippin SR, Deng Y, Hendi MS, Tirunahari PK, Lee Y-H, Haimowitz T, Alexander MD, Graham MA, Weng D, Shi Y, McKinlay MA, Chunduru SK (2014) Birinapant (TL32711), a bivalent SMAC mimetic, targets TRAF2-associated cIAPs, abrogates TNF-induced NF-κB activation, and is active in patient-derived xenograft models. Mol Cancer Ther 13:867–79. 10.1158/1535-7163.MCT-13-0798 [DOI] [PubMed] [Google Scholar]
- 8.Bai L, Smith DC, Wang S (2014) Small-molecule SMAC mimetics as new cancer therapeutics. Pharmacol Ther 144:82–95. 10.1016/j.pharmthera.2014.05.007 [DOI] [PMC free article] [PubMed] [Google Scholar]
- 9.Infante JR, Dees EC, Olszanski AJ, Dhuria S V, Sen S, Cameron S, Cohen RB (2014) Phase I dose-escalation study of LCL161, an oral inhibitor of apoptosis proteins inhibitor, in patients with advanced solid tumors. J Clin Oncol 32:3103–10. 10.1200/JCO.2013.52.3993 [DOI] [PubMed] [Google Scholar]
- 10.Tolcher A, Papadopoulos K, Patnaik A, Fairbrother W, Wong H, Budha N, Darbonne W, Peale F, Mamounas M, Royer-Joo S, Yu R, Portera C, Bendell J, Burris H, Tolcher JI, Papadopoulos K, Patnaik A, Fairbrother W, Wong H, Budha N, Darbonne W, Peale F, Mamounas M, Royer-Joo S, Yu R, Portera C, Bendell J, Burris H, Infante J (2013) Abstract 2503: Phase I study of safety and pharmacokinetics (PK) of GDC-0917, an antagonist of inhibitor of apoptosis (IAP) proteins in patients with refractory solid tumors or lymphoma. 2013 Annual Meeting of the American Society of Clinical Oncology (ASCO), Chicago, 31:2503. [Google Scholar]
- 11.Hurwitz HI, Smith DC, Pitot HC, Brill JM, Chugh R, Rouits E, Rubin J, Strickler J, Vuagniaux G, Sorensen JM, Zanna C (2015) Safety, pharmacokinetics, and pharmacodynamic properties of oral DEBIO1143 (AT-406) in patients with advanced cancer: results of a first-in-man study. Cancer Chemother Pharmacol 75:851–9. 10.1007/s00280-015-2709-8 [DOI] [PMC free article] [PubMed] [Google Scholar]
- 12.Amaravadi RK, Schilder RJ, Martin LP, Levin M, Graham MA, Weng DE, Adjei AA (2015) A Phase 1 study of the SMAC-mimetic birinapant in adults with refractory solid tumors or lymphoma. Mol Cancer Ther 10.1158/1535-7163.MCT-15-0475 [DOI] [PubMed] [Google Scholar]
- 13.Zhu X, Straubinger RM, Jusko WJ (2015) Mechanism-based mathematical modeling of combined gemcitabine and birinapant in pancreatic cancer cells. J Pharmacokinet Pharmacodyn 42:477–496. 10.1007/s10928-015-9429-x [DOI] [PMC free article] [PubMed] [Google Scholar]
- 14.Zhu X, Shen X, Qu J, Straubinger RM, Jusko WJ (2018) Multi-scale network model supported by proteomics for analysis of combined gemcitabine and birinapant effects in pancreatic cancer cells. CPT Pharmacometrics Syst Pharmacol (Accepted). [DOI] [PMC free article] [PubMed]
- 15.Zhu X, Shen X, Qu J, Straubinger RM, Jusko WJ (2018) Proteomic analysis of combined gemcitabine and birinapant in pancreatic cancer cells. Front Pharmacol 9:84 10.3389/fphar.2018.00084 [DOI] [PMC free article] [PubMed] [Google Scholar]
- 16.Trueman SA, Zhu X, Straubinger RM (2017) In vivo and in vitro pharmacodynamic analysis of dovitinib and gemcitabine interactions in pancreatic cancer models. Submitted
- 17.Wang H, Li M, Rinehart JJ, Zhang R (2004) Pretreatment with dexamethasone increases antitumor activity of carboplatin and gemcitabine in mice bearing human cancer xenografts: in vivo activity, pharmacokinetics, and clinical implications for cancer chemotherapy. Clin Cancer Res 10:1633–44. 10.1158/1078-0432.CCR-0829-3 [DOI] [PubMed] [Google Scholar]
- 18.Moore MM, Estrada VA, Nieves FE, Burns JM, Mitsuuchi Y, Chunduru SK, Graham MA, McKinlay MA, Tolcher AW, Wick MJ (2009) Abstract B163: Pharmacokinetic analysis and preclinical evaluation of the SMAC mimetic TL32711 in an orthotopic human breast tumor xenograft model. Mol Cancer Ther 8:B163 10.1158/1535-7163.TARG-09-B163 [DOI] [Google Scholar]
- 19.Ma WW, Zhang H, Hylander B, LeVea C, Repasky E, Weng D, Burns J, Chunduru S, Graham M, Fetterly G, McKinlay M, Adjei A (2012) Abstract 1939: TL32711, a novel Smac mimetic, exerts significant antitumor efficacy in primary pancreatic adenocarcinoma model. In: Proceedings of the 103rd Annual Meeting of the American Association for Cancer Research; 2012 Mar 31-Apr 4; Chicago, IL. Ph. Cancer Res 72:1939 10.1158/1538-7445.AM2012-1939 [DOI] [Google Scholar]
- 20.Baxter LT, Zhu H, Mackensen DG, Jain RK (1994) Physiologically based pharmacokinetic model for specific and nonspecific monoclonal antibodies and fragments in normal tissues and human tumor xenografts in nude mice. Cancer Res 54:1517–28. [PubMed] [Google Scholar]
- 21.Brown RP, Delp MD, Lindstedt SL, Rhomberg LR, Beliles RP (1997) Physiological parameter values for physiologically based pharmacokinetic models. Toxicol Ind Health 13:407–84. [DOI] [PubMed] [Google Scholar]
- 22.Pawaskar DK, Straubinger RM, Fetterly GJ, Hylander BH, Repasky EA, Ma WW, Jusko WJ (2013) Physiologically based pharmacokinetic models for everolimus and sorafenib in mice. Cancer Chemother Pharmacol 71:1219–1229. 10.1007/s00280-013-2116-y [DOI] [PMC free article] [PubMed] [Google Scholar]
- 23.Rodgers T, Leahy D, Rowland M (2005) Physiologically based pharmacokinetic modeling 1: predicting the tissue distribution of moderate-to-strong bases. J Pharm Sci 94:1259–76. 10.1002/jps.20322 [DOI] [PubMed] [Google Scholar]
- 24.La H, Halladay JS, Shin Y, Wong S, Plise E, Chan OH, Flygare J, Fairbrother W, Wong H(2010) Abstract P136: Preclinical pharmacokinetic assessment of GDC-0152, a selective antagonist of the Inhibitor of Apoptosis (IAP) Proteins. 9th Int Soc Study Xenobiotics Meet Drug Discov Dev Istanbul, Turkey [Google Scholar]
- 25.Zhang T, Li Y, Zou P, Yu J, McEachern D, Wang S, Sun D (2013) Physiologically based pharmacokinetic and pharmacodynamic modeling of an antagonist (SM-406/AT-406) of multiple inhibitor of apoptosis proteins (IAPs) in a mouse xenograft model of human breast cancer. Biopharm Drug Dispos 34:348–359. 10.1002/bdd.1850 [DOI] [PMC free article] [PubMed] [Google Scholar]
- 26.D’Argenio DZ, Schumitzky A, Wang X (2009) ADAPT 5 user’s guide: pharmacokinetic/pharmacodynamic systems analysis software.
- 27.Amaravadi RK, Senzer NN, Martin LP, Schilder RJ, Lorusso P, Papadopoulos KP, Weng DE, Graham M, Adjei AA (2013) Abstract 2504: A phase I study of birinapant (TL32711) combined with multiple chemotherapies evaluating tolerability and clinical activity for solid tumor patients. J Clin Oncol 31:2504. [Google Scholar]
- 28.Fetterly GJ, Liu B, Senzer NN, Amaravadi RK, Schilder RJ, Martin LP, Lorusso P, Papadopoulos KP, Adjei AA, Zagst PD, Mckinlay MA, Weng DE, Graham M, Park R, Cancer MC (2012) Abstract 3029: Clinical pharmacokinetics of the smac-mimetic birinapant (TL32711) as a single agent and in combination with multiple chemotherapy regimens. J Clin Oncol 30:3029.22802314 [Google Scholar]
- 29.Nishikawa Y, Tsuji Y, Isoda H, Kodama Y, Chiba T (2014) Perfusion in the tissue surrounding pancreatic cancer and the patient’s prognosis. Biomed Res Int 2014:648021 10.1155/2014/648021 [DOI] [PMC free article] [PubMed] [Google Scholar]
- 30.Bouffard DY, Laliberté J, Momparler RL (1993) Kinetic studies on 2’,2’-difluorodeoxycytidine (Gemcitabine) with purified human deoxycytidine kinase and cytidine deaminase. Biochem Pharmacol 45:1857–61. [DOI] [PubMed] [Google Scholar]
- 31.Ebrahem Q, Mahfouz RZ, Ng KP, Saunthararajah Y (2012) High cytidine deaminase expression in the liver provides sanctuary for cancer cells from decitabine treatment effects. Oncotarget 3:1137– 45. 10.18632/oncotarget.597 [DOI] [PMC free article] [PubMed] [Google Scholar]
- 32.Sugiyama E, Kaniwa N, Kim S-R, Hasegawa R, Saito Y, Ueno H, Okusaka T, Ikeda M, Morizane C, Kondo S, Yamamoto N, Tamura T, Furuse J, Ishii H, Yoshida T, Saijo N, Sawada J-I (2010) Population pharmacokinetics of gemcitabine and its metabolite in Japanese cancer patients: impact of genetic polymorphisms. Clin Pharmacokinet 49:549–58. 10.2165/11532970-000000000-00000 [DOI] [PubMed] [Google Scholar]
- 33.Zhang L, Sinha V, Forgue ST, Callies S, Ni L, Peck R, Allerheiligen SRB (2006) Model-based drug development: the road to quantitative pharmacology. J Pharmacokinet Pharmacodyn 33:369–93. 10.1007/s10928-006-9010-8 [DOI] [PubMed] [Google Scholar]
- 34.Kuenen BC, Rosen L, Smit EF, Parson MRN, Levi M, Ruijter R, Huisman H, Kedde MA, Noordhuis P, van der Vijgh WJF, Peters GJ, Cropp GF, Scigalla P, Hoekman K, Pinedo HM, Giaccone G (2002) Dose-finding and pharmacokinetic study of cisplatin, gemcitabine, and SU5416 in patients with solid tumors. J Clin Oncol 20:1657–67. [DOI] [PubMed] [Google Scholar]
- 35.Kazmi F, Hensley T, Pope C, Funk RS, Loewen GJ, Buckley DB, Parkinson A (2013) Lysosomal sequestration (trapping) of lipophilic amine (cationic amphiphilic) drugs in immortalized human hepatocytes (Fa2N-4 cells). Drug Metab Dispos 41:897–905. 10.1124/dmd.112.050054 [DOI] [PMC free article] [PubMed] [Google Scholar]
- 36.Dovzhanskiy DI, Arnold SM, Hackert T, Oehme I, Witt O, Felix K, Giese N, Werner J (2012) Experimental in vivo and in vitro treatment with a new histone deacetylase inhibitor belinostat inhibits the growth of pancreatic cancer. BMC Cancer 12:226 10.1186/1471-2407-12-226 [DOI] [PMC free article] [PubMed] [Google Scholar]
- 37.Nolan-Stevaux O, Tedesco D, Ragan S, Makhanov M, Chenchik A, Ruefli-Brasse A, Quon K, Kassner PD (2013) Measurement of cancer cell growth heterogeneity through lentiviral barcoding identifies clonal dominance as a characteristic of in vivo tumor engraftment. PLoS One 10.1371/journal.pone.0067316 [DOI] [PMC free article] [PubMed] [Google Scholar]
- 38.Trédan O, Galmarini CM, Patel K, Tannock IF (2007) Drug resistance and the solid tumor microenvironment. J Natl Cancer Inst 99:1441–54. 10.1093/jnci/djm135 [DOI] [PubMed] [Google Scholar]
Associated Data
This section collects any data citations, data availability statements, or supplementary materials included in this article.