
Figure 1.
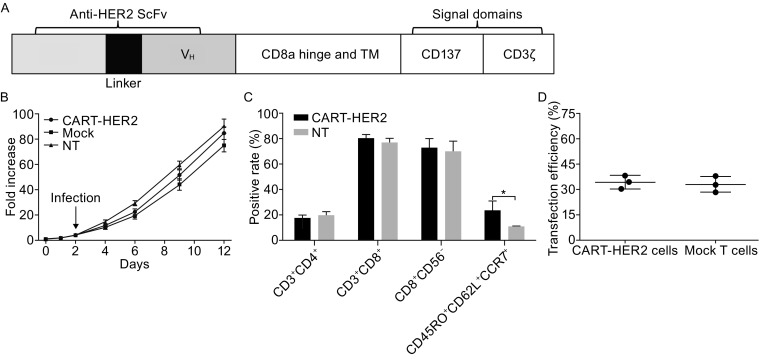
Generation, expansion, and characterization of HER2-directed chimeric antigen receptor T cells. (A) Schematic representation of anti-HER2 CAR gene sequence (not drawn to scale). (B) Average expansion (-fold) of CART-HER2, mock T, and NT T cells, produced using PBMCs from three healthy donors; the cells were cultured in vitro for 10–14 days. Mean and SDs are shown for three different T-cell lines. (C) Phenotypic features of CART-HER2 and NT T cells, from three healthy donors, were evaluated by FACS analysis on day 12 of culture. Mean positive rates ± SD from three different T-cell lines are shown. (D) Transfection efficiency of CAR or mock gene into T cells was determined by FACS analysis using the marker GFP on day 12. The data are represented as means ± SD. *Represents P < 0.05