
Figure 2.
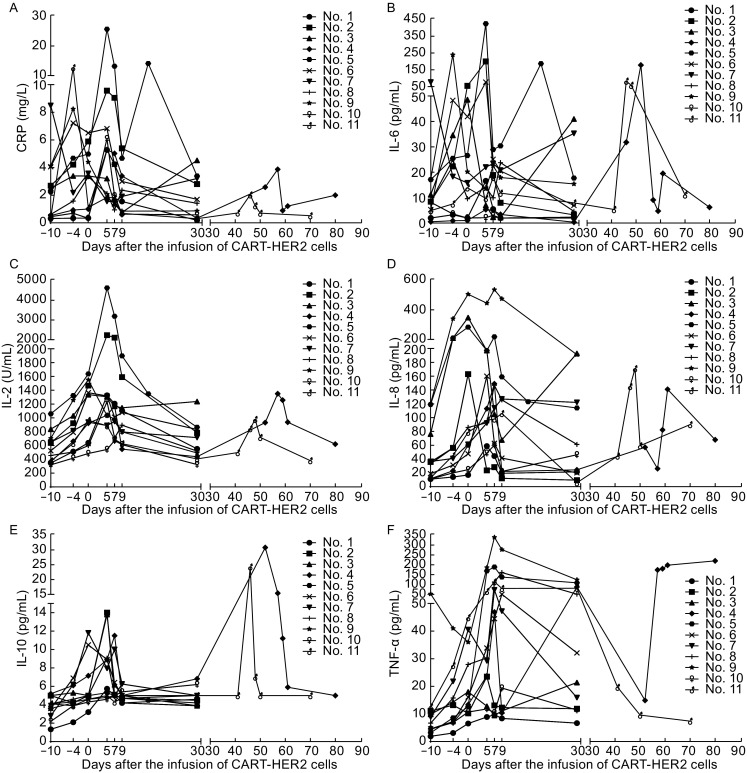
Release of CRP and cytokines at scheduled time points and occasional time points from patients’ peripheral blood since the enrollment of CART-HER2 cell therapy. (A) Change of CRP during the CART-HER2 cell therapy. (B) The level of IL-6 release monitored according to the study flowchart. (C) Release of interleukin-2 (IL-2). (D) Fluctuation of interleukin-8 (IL-8) following the treatment of CART-HER2 cell infusion. (E) Interleukin-10 (IL-10) detected after the CART-HER2 cell treatment. (F) Release of tumor necrosis factor-α (TNF-α)