Figure 1.

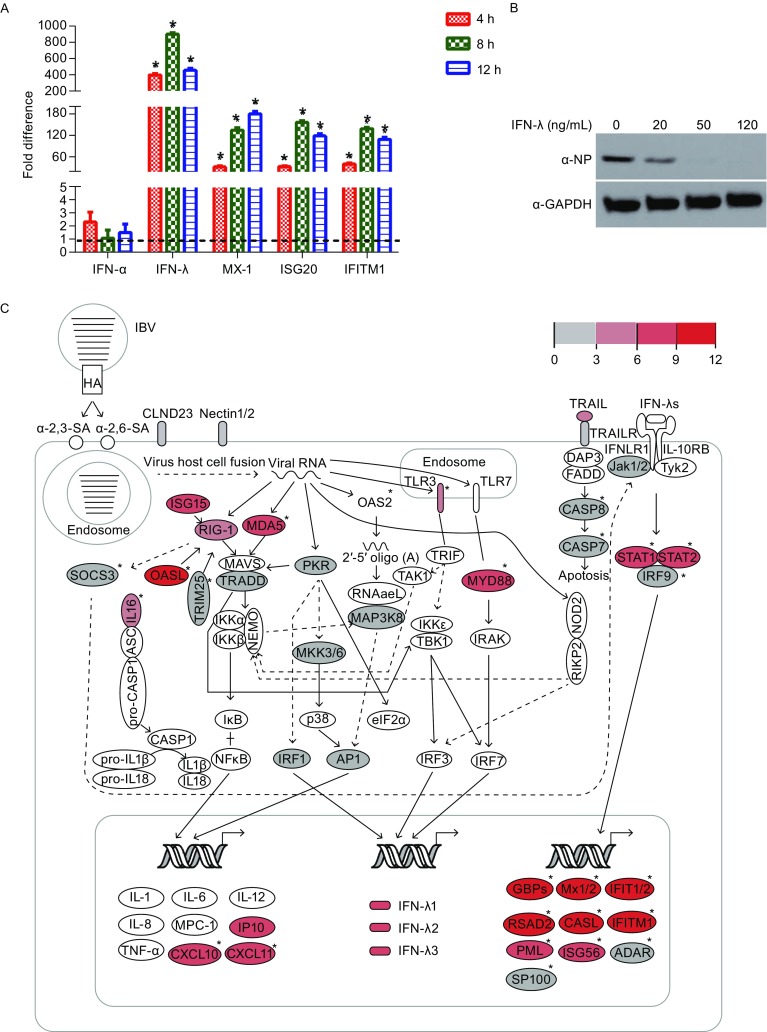
The integrated signaling pathway for IBV infection in A549 cells. (A) qRT-PCR analysis of the expression of selected genes in IBV infected A549 cells compared with uninfected controls. The fold difference was determined using the 2−∆∆Ct method, and RNA levels were normalized to GAPDH. Error bars represent the standard deviation. (B) A549 cells were treated with recombinant human IFN-λ (R&D systems) at final concentration of 0, 20, 50 and 100 ng/mL, followed by infection with IBV for 12 h. Cell lysates were analyzed by western blot using indicated antibodies. (C) The pathways for IBV infection in A549 cells. The relative expression values are indicated by the color gradient. The full lines represent direct interactions, and the dashed lines represent indirect interactions. The uncolored ellipses represent genes that are not DEGs. ISGs are marked with an asterisk
