Fig. 2.
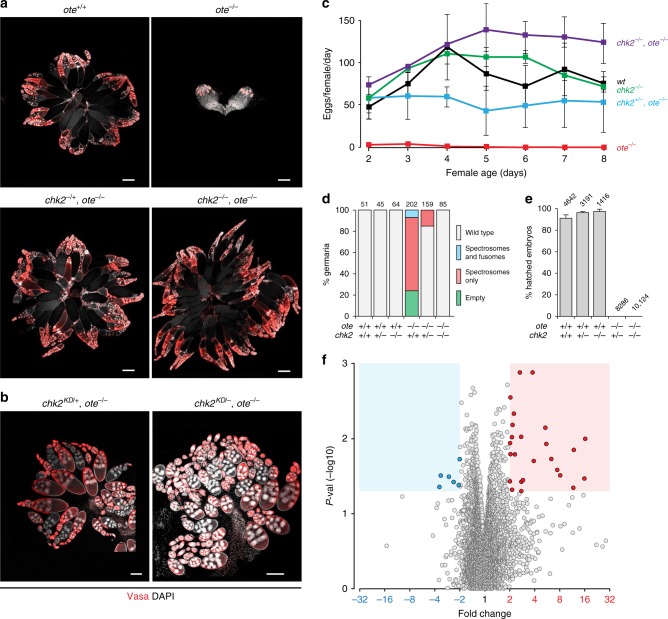
Chk2 activation is responsible for oogenesis defects in ote mutants. a, b Confocal images of ovaries dissected from less than 2-day-old females stained for Vasa (red) and DAPI (white). Genotypes are noted on the top of each image, wherein ote−/− corresponds to oteB279G/PK. The chk2- alleles were either deletion alleles (a) or a kinase dead allele (Table S1, b). Scale bars represent 250 µm (a) or 100 µm (b). c Fecundity (eggs per female per day) of females mated to ote+/+ males as a function of female age in days. Bars indicate the standard deviation from a minimum of three independent experiments, assaying 7–15 females each time. Genotypes are noted to the right of each line. d Quantification of germarial phenotypic classes, as described on the right12. Genotypes are listed below the corresponding bar, with the number of germaria scored listed at the top. e Percentage of eggs that hatched within 48 h following deposition by females that were mated to ote+/+ males. Bars represent the standard deviation from at least two independent experiments. The number of eggs analyzed is noted above each bar. f Volcano plot of gene expression microarray results. The x-axis shows fold change between NULL (chk2P6, otePK/ oteB279G and otePK/ chk2P30, oteB279G), and HET (chk2P6, otePK/ CyO and chk2P30, oteB279G/ CyO) ovaries and the y-axis shows one-way ANOVA p value; areas corresponding to twofold change cutoff and p < 0.05 are shaded, points corresponding to significantly decreasing or increasing RNAs are colored blue and red, respectively

