Fig. 4.
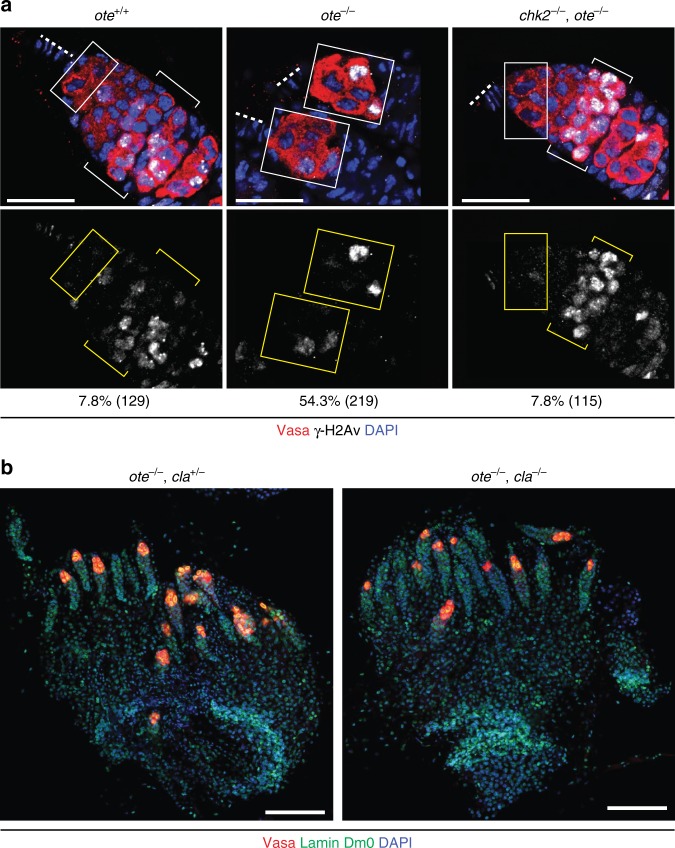
DNA damage in ote−/− GSCs is downstream of Chk2. a Confocal images of germaria stained with antibodies against Vasa (red), DNA damage marker γ-H2Av (grayscale) and with DAPI (blue). Genotypes are noted above each image, wherein ote−/− corresponds to oteB279G/PK and chk2−/− corresponding to chk2P6/P30. Bottom: Image of the signal in the γ-H2Av channel. Boxes and brackets indicate GSCs and meiotic germ cells, respectively. Dashed line indicates the position of GSC niche. The percentage of γ-H2Av-positive GSCs is noted at the bottom of the γ-H2Av image, with the number of GSCs analyzed in parenthesis. All scale bars represent 20 µm. b Confocal images of whole mount ovaries dissected from ote mutants with heterozygous or homozygous loss of Claspin (Cla). Ovaries were stained for Vasa (red), Lamin Dm0 (green), and DNA (DAPI, blue), revealing the absence of suppression of ote mutant phenotypes. Genotypes are indicated at the top of each image, with ote−/− corresponding to oteB279G/PK; scale bars represent 100 µm

