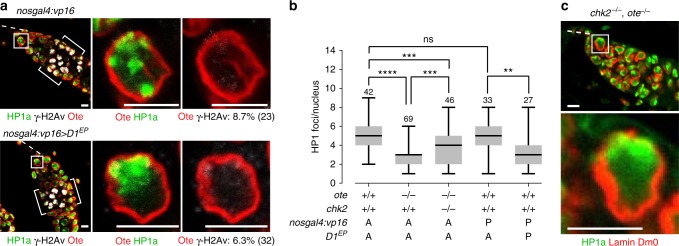
Fig. 6.
HP1a coalescence does not lead to increased γH2Av staining or GSC loss. a Confocal images of germaria and GSC nuclei in females carrying either the nosgal4:vp16 driver alone (top) or the nosgal4:vp16 and the D1EP473 allele (bottom). Ovaries were stained with antibodies against HP1a (green), γ-H2Av (white), and Ote (red). The percentage of γ-H2Av-positive GSCs is noted at the bottom of the GSC image, with the number of GSCs analyzed in parenthesis. Scale bars represent 5 μm. b Box plots of the quantification of HP1a foci per GSC nucleus found in GSCs of the indicated genotype. Genotypes are noted below each box plot, and the number of nuclei analyzed is noted above each top whisker. An A indicates absence of the nosgal4:vp16 driver or the D1EP allele, and P indicates their presence. For each box plot, the box represents the 25th to 75th percentile interval, the line represents the median and the whiskers represent the 5th to 95th percentile interval and non-outlier range. Asterisks indicate significance (one-way ANOVA, ns = not significant, **<0.01, ***<0.001, ****<0.0001). c Confocal images of a GSC nucleus from 1-day-old chk2−/−, ote−/− females stained for Lamin Dm0 (red) and HP1a (green), revealing that nuclear structural defects are upstream of Chk2. Genotypes are listed above each image. The chk2−/− corresponds to chk2P6/chk2P30 and ote−/− corresponds to oteB279G/PK. The box outlines GSCs. Scale bars represent 5 μm

