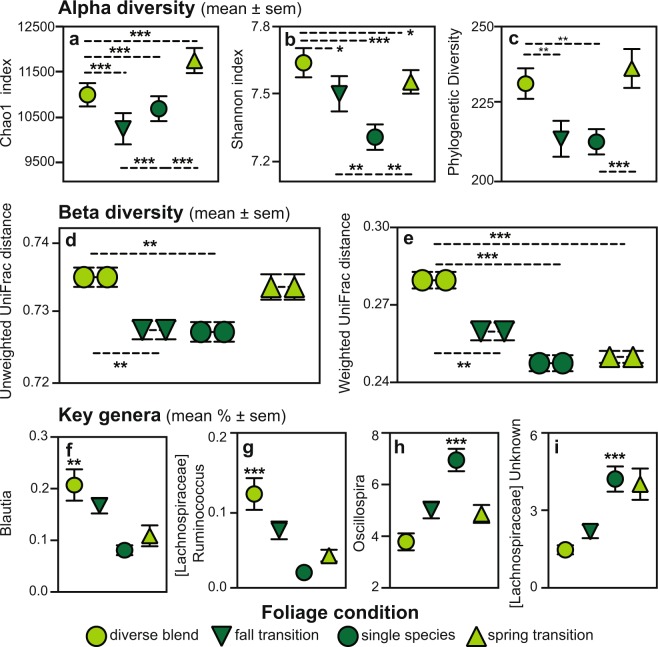
Figure 4.
Gut microbiome diversity and the percentages of key microbial genera in the sifakas of Study 2. Pictured are measures of alpha diversity, including the (a) Chao1, (b) Shannon and (c) Phylogenetic Diversity indices, beta diversity, including (d) unweighted and (e) weighted UniFrac distances (shown by paired symbols), and taxa, including (f) Blautia, (g) Ruminococcus from the Lachnospiraceae family, (h) Oscillospira and (i) and an unknown genus from the Lachnospiraceae family. Each measure is binned relative to foliage condition, including diverse blends (light green) and single species (dark green), as well as the timing of sampling, including during periods of consistent foliage supplements (circles), and during the week-long transitions when foliage condition was abruptly switched in fall (downward-pointing triangles) and spring (upward pointing triangles). *p < 0.05; **p < 0.01; ***p < 0.001.

