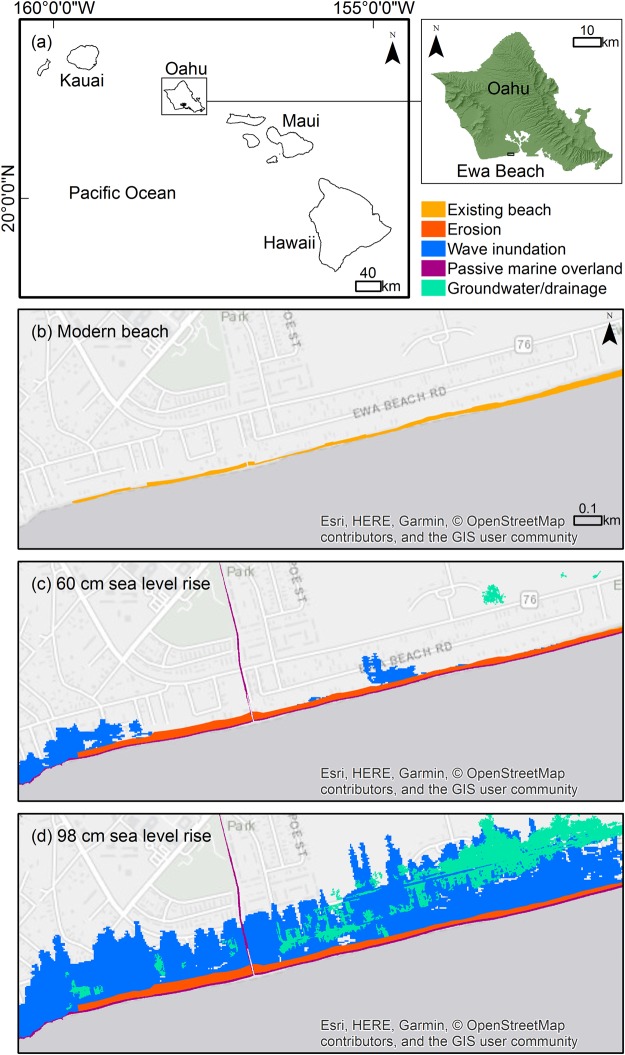
Figure 2.
Modeled exposure to sea level-related hazards at ‘Ewa Beach, O‘ahu, show the localized spatial distribution of lands exposed to passive marine overland flooding at high tide (maroon), passive groundwater flooding/drainage backflow from the ocean at high tide (green), seasonal wave inundation (dark blue), and chronic erosion (red). The existing beach area is shown in orange; (a) location map; (b) present-day beach; (c) 0.60 m SLR scenario; (d) 0.98 m SLR scenario. (The cartography in the OpenStreetMap map tiles is licensed under CC BY-SA. The license terms can be found at: www.openstreetmap.org/copyright).

