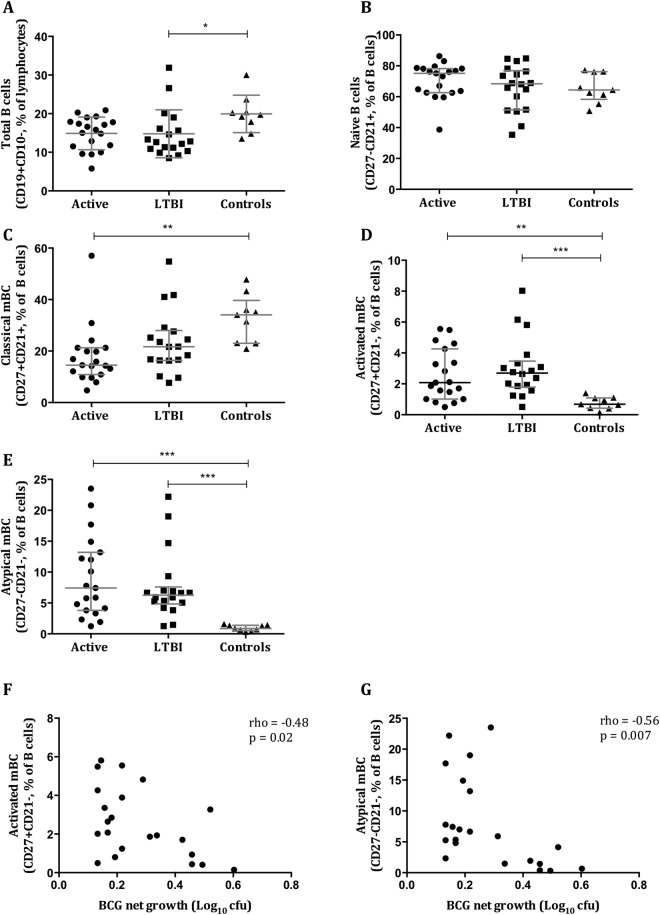
Figure 4.
Increases in activated and atypical memory B cells occur in M.tb infection and correlate with improved mycobacterial control. B cell subsets were characterised among patients with active TB disease (n = 19), LTBI (n = 18) and healthy controls (n = 9) before starting anti-TB treatment. The proportions of mature (A), naïve (B), classical (C), activated (D) and atypical (E) B cells are shown. Negative correlations between the proportion of activated (F) and atypical (G) B cells and BCG net growth were seen. Points are single values and bars represent the median with interquartile range. After testing for normality a Kruskal-Wallis test with Dunn’s correction for multiple comparisons was performed. *Represents a p-value of <0.05, **a p-value of <0.005, ***a p-value of <0.0005 and ****a p-value of <0.0001. Spearman’s rho and associated p-values are shown.

