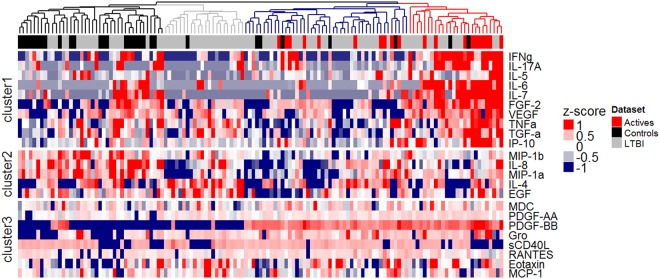
Figure 6.
Serum cytokine analysis reveals discrete clusters, which delineate the spectrum of M.tb infection and strong negative correlations with ex vivo mycobacterial growth. Serum cytokine/chemokine responses in pre-treatment samples from active TB (n = 20), LTBI (n = 83) and healthy control individuals (n = 30) were investigated by Luminex assay. A heatmap of cytokine/chemokine levels (log, row scaled, pg/ml) is shown. Samples were clustered according to Spearman correlation distance and the four most distinct clusters were coloured in black, grey, blue and red. For clustering of cytokines/chemokines into three clusters, k-means clustering was applied to the rows.

