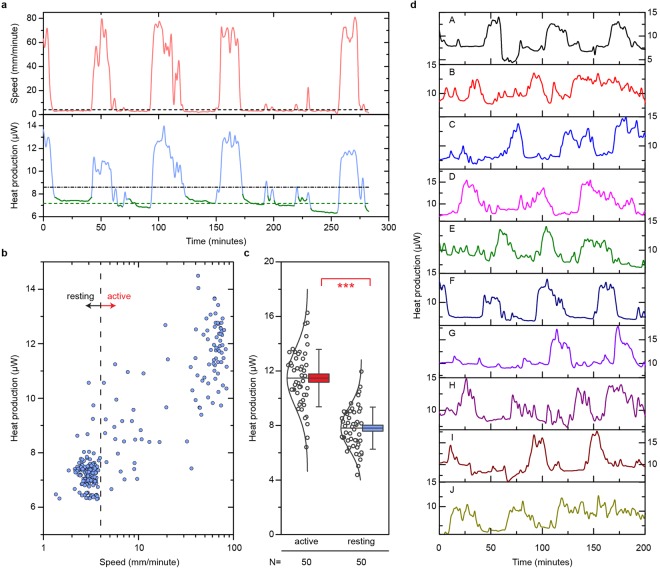
Figure 2.
Metabolic measurements. (a) Time traces showing the speed of locomotion (upper panel) and heat production (lower panel) of a single Canton S (female, 3 days after eclosion) over the course of an experiment. The black dashed line in the upper panel delineates the 4 mm/min threshold for defining the rest state, and the green portions of the heat production trace (lower panel) indicate the times for which the rest condition is met. The dashed green line indicates the average basal heat production while the black dashed-dotted line represents the total average heat production for this fly. (b) Heat production plotted against activity level for the same single Canton S fly from (a). The dashed vertical line indicates the threshold for the rest condition. (c) Heat production data for a population of 50 individual Canton S flies averaged during periods of high (>50 mm/min) and low (<4 mm/min) activity. The horizontal line represents the mean for a sample. Box boundaries indicate the standard error of the mean, and error bars represent the standard deviation of the sample. The open circles to the left of the boxes signify the average heat production for the individual flies. ***p < 0.001. (d) Heat production data for ten flies (A–J) during a single experiment. Fly F is shown in (a,b).

