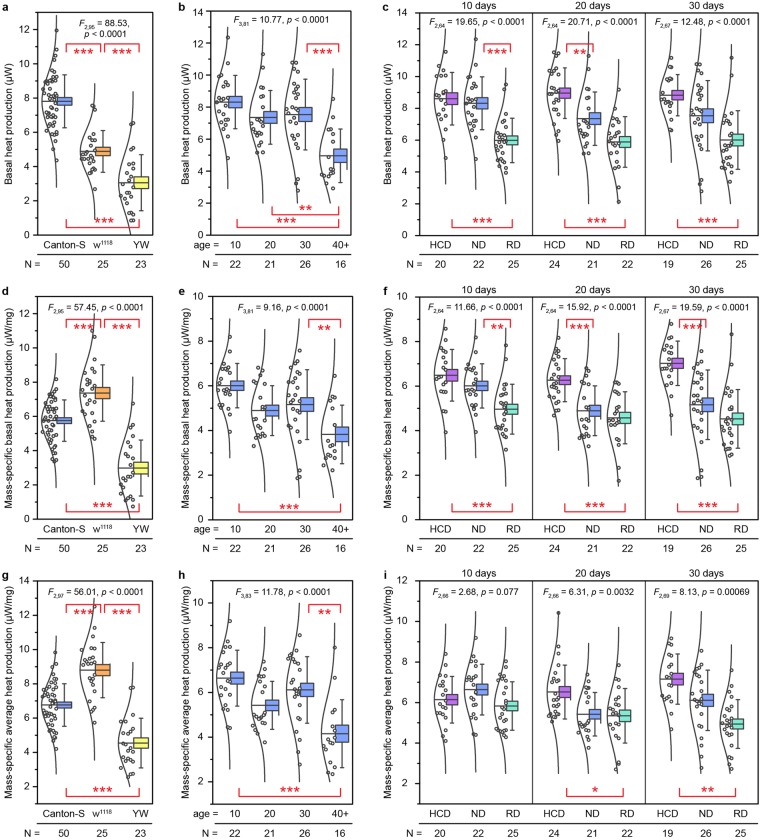
Figure 3.
Basal and average metabolic heat production rates. (a–c) Basal heat production as measured for: (a) the three Drosophila genotypes considered: Canton S, w1118, and yw, (b) Canton S flies of different ages, and (c) Canton S flies on high calorie (HCD), normal (ND) and restricted diets (RD) at different ages. (d–f) Mass-specific basal metabolic rate of flies (see Supplementary Fig. S2) of different: (d) genotypes, (e) ages, and (f) dietary conditions. (g–i) Mass-specific average heat production for the same flies as in (a–c). Shown are the mean (horizontal line), standard error (box) and standard deviation (error bars). The open circles to the left of the boxes represent the average heat production for individual flies and N indicates the sample size. ANOVA results are indicated on each panel; Tukey’s tests are indicated pairwise: *p < 0.01, **p < 0.005, ***p < 0.001.

