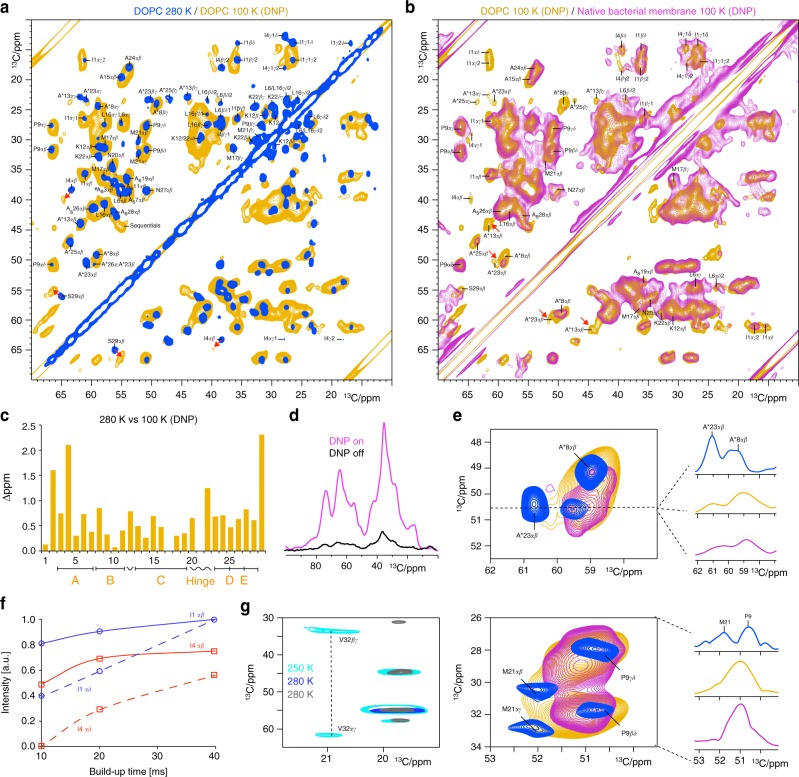
Fig. 3.
DNP-enhanced ssNMR on the lipid II-bound state of nisin in the pore. a 2D 13C–13C ssNMR spin diffusion spectra of the lipid II-bound state of nisin in the pore in DOPC acquired at 280 K sample temperature (blue) and at 100 K with DNP enhancement (orange). Red arrows highlight strong CSPs. b Overlay of DNP-ssNMR 2D 13C–13C spectra of nisin in the pore acquired in DOPC (orange) and in cellular M. flavus vesicles (magenta). Both spectra were acquired at identical conditions using 10.6 kHz MAS, 800 MHz and 40 ms 13C–13C mixing. c Combined (Cα + Cβ) CSPs comparing lipid II-bound nisin in DOPC at 280 K against 100 K temperature (DNP conditions). d 13C cross-polarization spectra of lipid II-bound nisin in M. flavus vesicles with (magenta) and without (black) DNP enhancement. e The hinge domain is conformationally flexible and broadens out at DNP conditions in DOPC (orange). This is even more pronounced in cellular membranes (magenta). Upper panel: (left) zoom into A*23 adjacent to the hinge; (right) slice through the A*23αβ signal. Lower panel: (left) zoom into M21; (right) projection along the indirect dimension (26–34 13C ppm). f 13C–13C PDSD spin diffusion buildup curves of the Cαβ (continuous lines) and Cαδ (dashed lines) cross-peaks for residues I1 (in blue) and I4 (red). g The mobile nisin C terminus gives faint signals in dipolar 2D 13C–13C spectra at 280 K (in gray and dark blue with 100 ms and 30 ms 13C–13C mixing, respectively), while stronger signals appear at 250 K (in cyan, 50 ms mixing)

