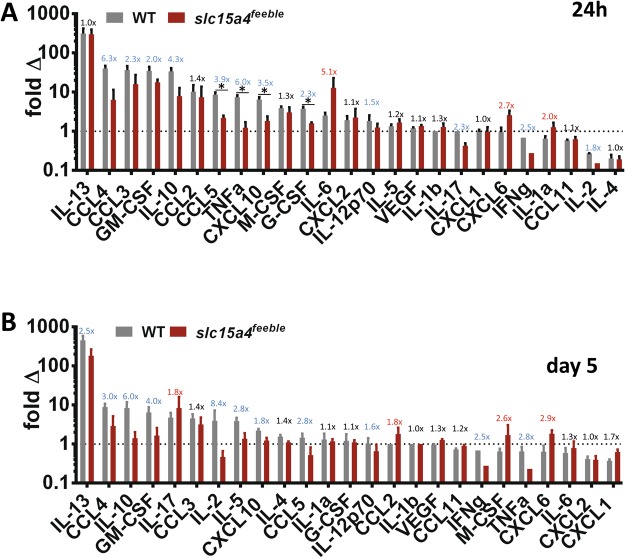
Figure 5.
slc15a4 contributes to IMQ driven cytokine storm. Inflammatory cytokine plasma concentrations were measured following IMQ treatment using a 25-cytokine luminex assay. Fold changes (IMQ-treated at the indicated timepoint/time = 0) are shown at 24 hours (A) and 5 days (B). Cytokines were rank-ordered for IMQ-induction in WT. The dotted line represents where IMQ treatment does not affect circulating cytokine levels. The ratio of IMQ-induced fold changes are displayed in blue (decreased), red (increased) and black (<1.5x changed) comparing mutant to WT. Data was combined from three independent experiments with a total of 5–13 mice per group. *p < 0.05 in unpaired T-test after multiple comparison correction.

