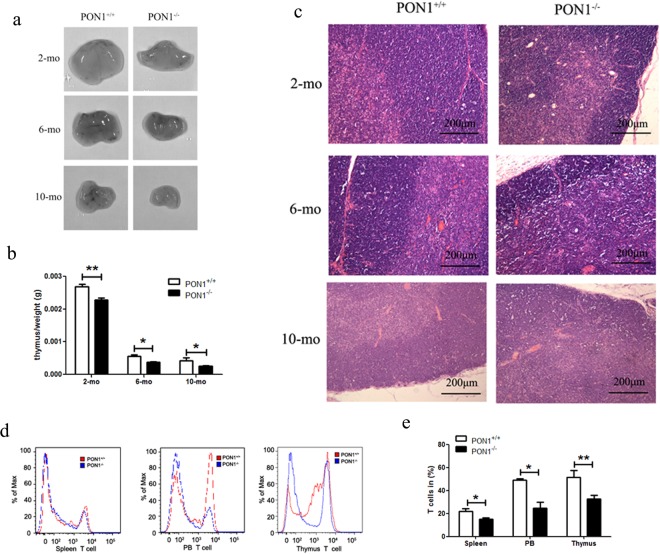
Figure 2.
Reduced percentage of thymocytes in PON1−/− rats. (a) Images of the thymus from 2, 6 and 10-month-old PON1−/− and PON1+/+ rats (n = 5 per group). (b) Weight of the thymus from PON1−/− and PON1+/+ rats aged 2-months (n = 9 per group), 6-months (n = 6 per group) and 10-months (n = 5 per group) old. (c) Hematoxylin and eosin staining of thymus from PON1−/− and PON1+/+ rats aged 2-months, 6-months and 10-months (n = 3 per group). Scale bar = 200 μm. (d) Representative histograms of T cells numbers in the spleen, peripheral blood (PB), and thymus from PON1−/− and PON1+/+ rats aged 2 months. (e) Flow cytometric analysis of the percentage of T cells in the spleen, PB, and the thymus from 2-month-old PON1−/− and PON1+/+ rats. Data represent the mean ± SD of three independent experiments (n = 5 per group). *P < 0.05; **P < 0.01.

