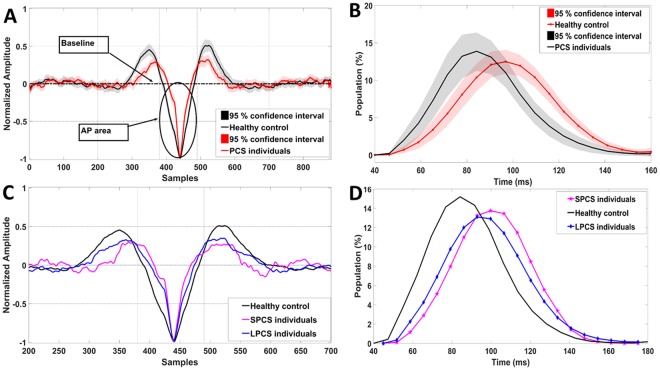
Figure 2.
(A) Average response for control (n = 33) and PCS (long and short-term PCS, n = 59) groups. The marked circles/arrows show significant (P < 0.05) difference in the AP-area between control and concussed during static segment. (B) Interval Histogram for an FP gap equal to 33 FPs during static segment. The black and red solid lines represent the healthy controls (n = 33) and PCS (long and short-term PCS, n = 59) encased by dashed 95% confidence interval lines, respectively. (C) Average response for control (n = 33), SPCS (n = 15) and LPCS (n = 44), x-axis was zoomed-in to samples (200:700) to make the AP-area change more visible. (D) Interval Histogram for an FP gap equal to 33 FPs during static segment. The black, blue and pink solid lines represent the healthy controls (n = 33), SPCS (n = 15) and LPCS (n = 44) respectively.

