Figure 3.

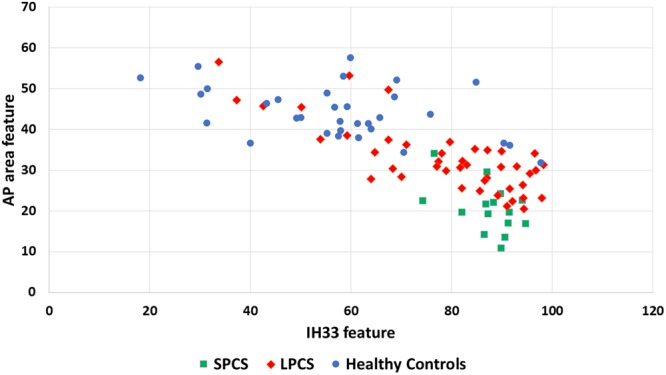
Scatter plot of healthy controls (n = 33) versus PCS group (n = 59) using AP-area and IH33 features. The two subbroups of short- and long-term PCS (SPCS, n = 15 and LPCS, n = 44) are shown with different colors and markers.

Scatter plot of healthy controls (n = 33) versus PCS group (n = 59) using AP-area and IH33 features. The two subbroups of short- and long-term PCS (SPCS, n = 15 and LPCS, n = 44) are shown with different colors and markers.