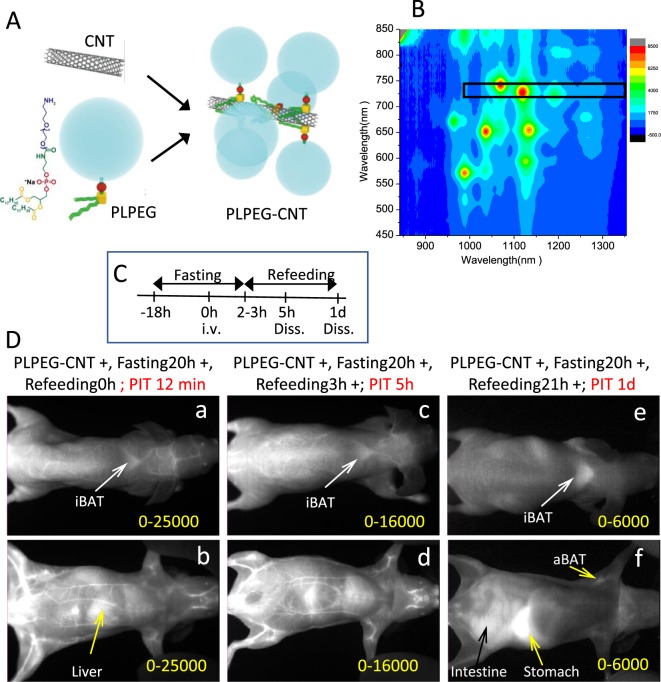
Figure 1.
(A) Schematic illustration of PLPEG, CNT, and a supposed structure of PLPEG-CNT. (B) Fluorescent spectrum of PLPEG-CNT dispersed in water. The black rectangular in “B” denotes the excitation and fluorescence wavelength region used in the imaging. (C) Time table of fasting, feeding, intravenous injection (i.v.) of PLPEG-CNT, and dissection (Diss.). (D) Images of fasted mice at PIT 12 minutes (a,b), 5 h (c,d), and (1D,e,f). Dorsal images (a,c,e) and ventral images (b,d,f). Image-signal-intensity ranges denoted with yellow numbers are optimized for the whole-body visualization at each time point (n = 4).

