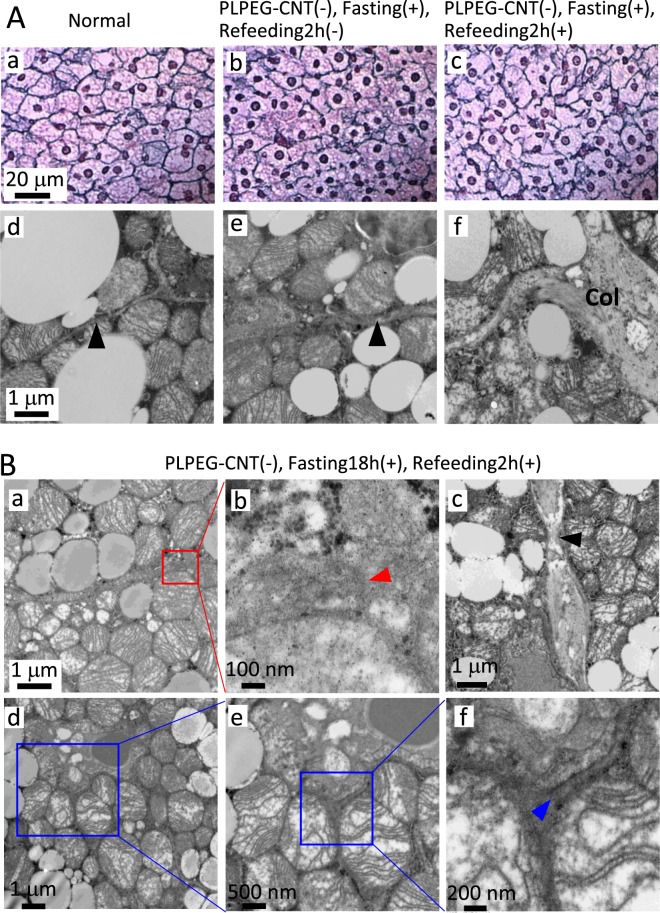
Figure 4.
(A) Optical micrographs of iBATs stained with silver-impregnation (a–c), and TEM images of iBAT stained with Os (d–f) for a normal mouse (PLPEG-CNT−, no fasting) (a,d), a mouse (PLPEG-CNT−, fasting18h+, Refeeding2h−) (b,e), and a mouse (PLPEG-CNT−, fasting18h+, Refeeding2h+) (c,f). Reticular fibers (type III collagen) was stained black with silver impregnation. Black arrow heads point the inter-cellular spaces. (n = 2) (B) TEM of iBAT of a mouse (PLPEG-CNT−, fasting18h+, Refeeding2h+). An end of the collagen band (a,b, red arrow head), narrow part of collagen (c, black arrow head), and the gap junction (d–f), showing its end (f, blue arrow head) (n = 1).

