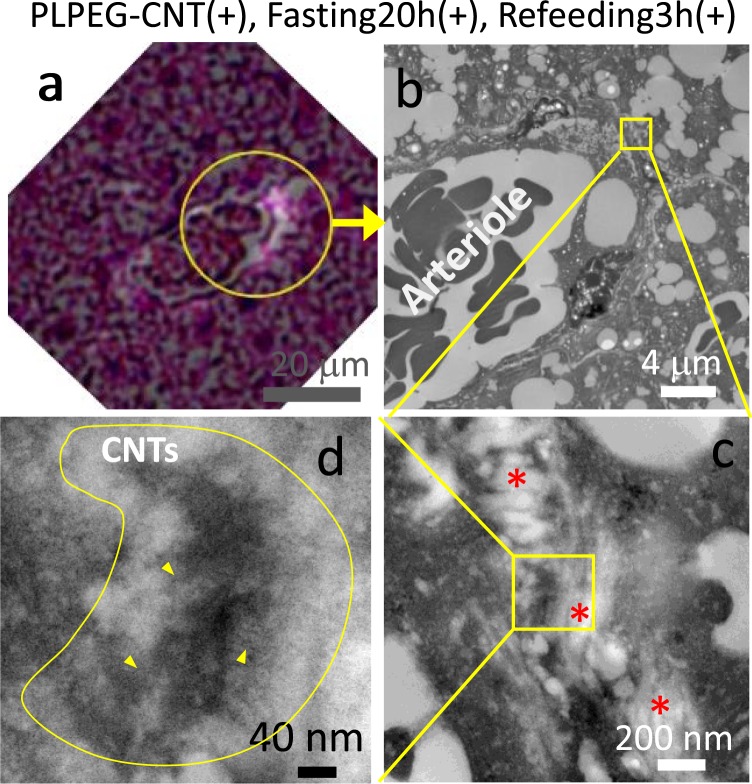
Figure 7.
Micrographs of iBAT of the mouse (PLPEG-CNT+, fasting20h+, Refeeding3h+; PIT5h). A merged micrograph of a visible-light image and NIR-fluorescent image of a slice taken from the same paraffin block used for “Fig. 6B” (a). TEM images of an area in the circle of “a” (b–d). Tissue thickness of “a” and “b-d” were 5 μm and 80 nm, respectively. The CNT-containing agglomerate is highlighted by enclosing with a yellow line in “d.” Yellow arrow heads point some of the CNTs among many others. Red asterisks in “c” denote collagens (n = 1).

