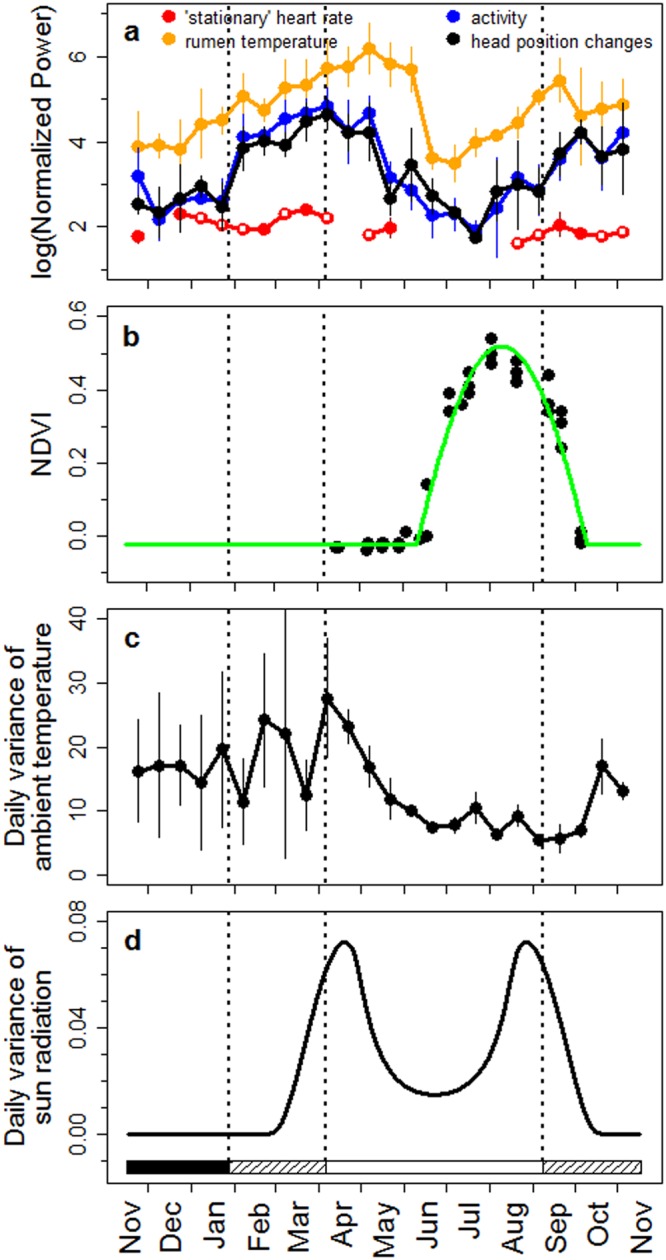
Figure 3.

Annual course of circadian rhythmicity and potential zeitgebers. (a) Average normalized power of significant rhythms (p < 0.05) with period lengths between 21 and 27 hours, calculated with Lomb-Scargle periodogram analyses for 15-day intervals from Nov 15, 2012 to Nov 15, 2013, for ‘stationary’ heart rate (red), rumen temperature (orange), activity (blue), and head position changes (black; means and 95% confidence intervals reflecting variation between individuals, open symbols are single values). Note that more significant rhythms are found here compared to the analyses depicted in third panels of Supplementary Figs S4–S14. This is because the probability of detecting significant peaks depends on the number of periods scanned, i.e., it is higher when searching for periods between 21 to 27 hours than between 0.5 to 30 hours, as done for Supplementary Figs S4–S14. (b) 16-day averages of NDVI values from the three major parts of the study site for 2013 (see Fig. 1) and a baseline cosine fit to this data. (c) Ambient temperature measured in the collar (15-day means of daily variation and 95% confidence intervals, reflecting variation between individuals). (d) Daily variance of direct maximum solar radiation at the study site (disregarding weather effects). Horizontal bars and dotted vertical lines in each plot indicate periods of continual darkness (black), daylight/night changes (hatched), and continual daylight (open). Note that periods of daylight/night changes begin before and end after the sun firstly and lastly arises above the horizon. This difference results from using civil twilight for calculating beginning and end of daylight.
