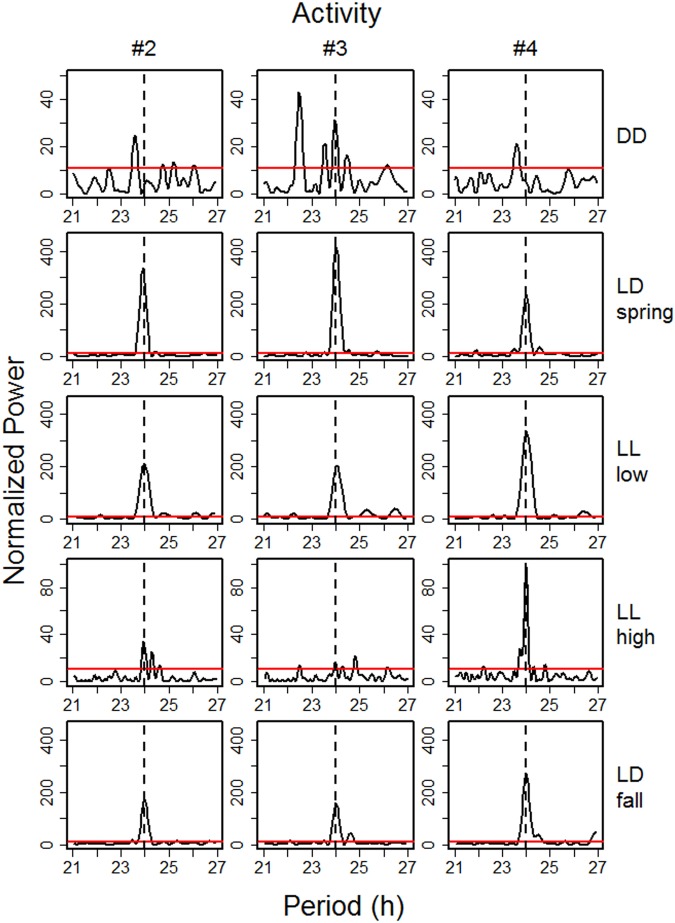
Figure 4.
Comparison of rhythms of activity with period lengths between 21 and 27 hours of study animals #2, #3, and #4 between Nov 15, 2012 and Nov 15, 2013. Plotted are normalized powers of rhythms of activity. Each row of panels represents the different time periods: Polar Night (DD), daylight and night (LD), continual light (Midnight Sun, LL) before the onset of new vegetation growth with NDVI values <0 (LL low), and continual light with above-ground new vascular plant growth (NDVI >0, LL high). Horizontal red lines indicate the significance threshold of p = 0.001.

