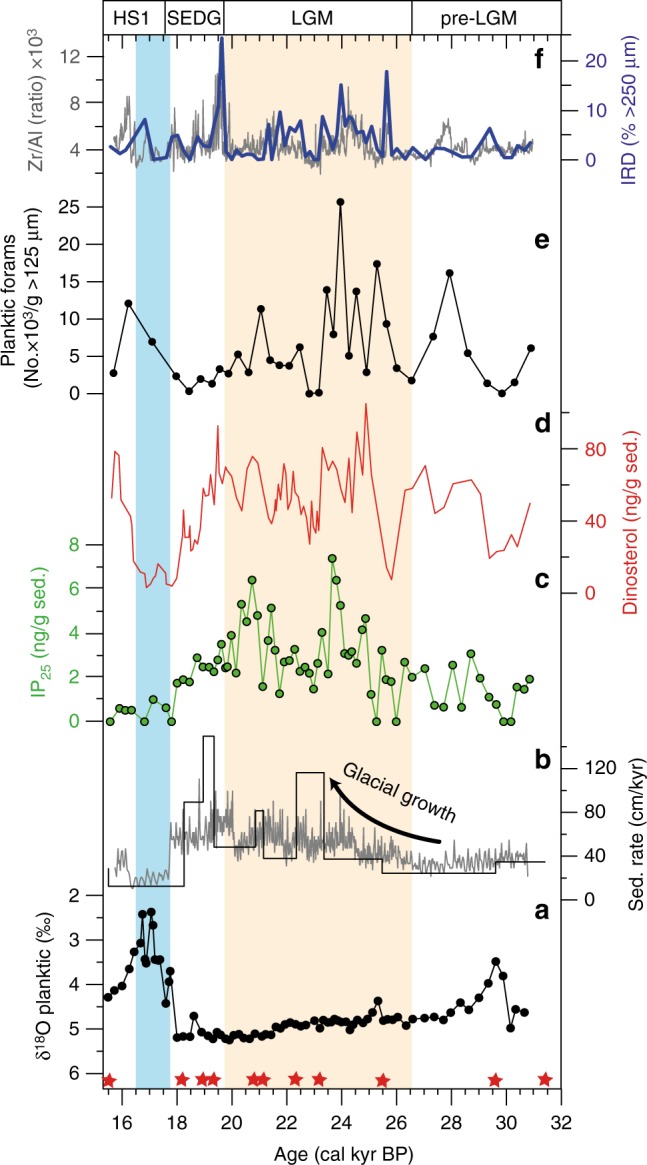
Fig. 5.

Proxy data of sediment cores GC14-190-01PC for the late glacial period (ca. 31–15 cal. kyr BP). a Planktic δ18O (‰) measured on Neogloboquadrina pachyderma sin. b Sedimentation rates (cm/kyr) inferred from Bayesian age-depth modeling (Bacon v2.2) (black line) and linear interpolation (gray line) between 11 AMS14C dates (red asterisks at bottom). c IP25 concentration (ng/g Sed) (green dots). d Dinosterol concentration (ng/g Sed). e Number of planktic foraminifera in coarse fraction (>125 µm) in thousands. f Ice rafted debris (IRD) inferred from % of >250 µm coarse fraction (blue line) and XRF based Zr/Al ratio (gray line). HS1: Heinrich Stadial 1, SEDG: Shelf Edge Deglaciation, LGM: Last Glacial Maximum (beige colored)19. The bluish rectangle marks the freshwater release during Svalbard Barents Sea ice sheet collapse
