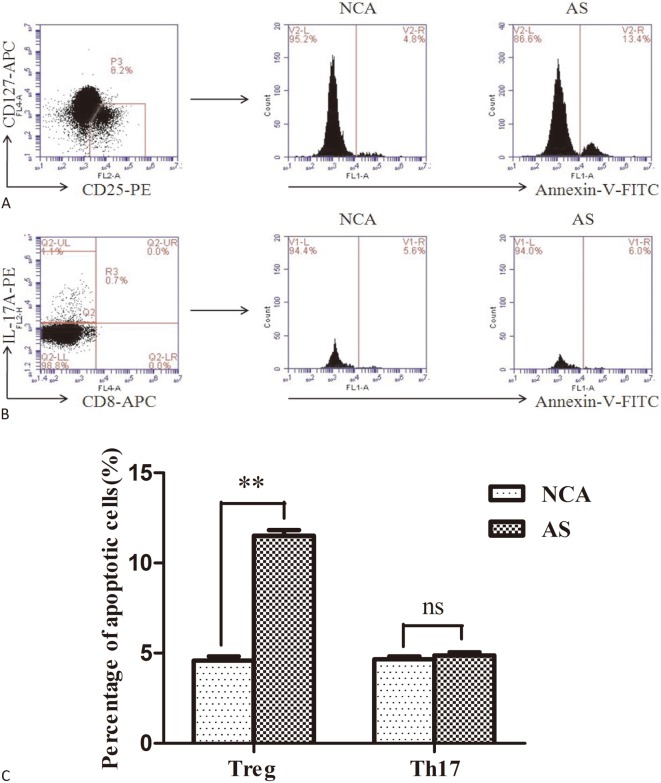
Figure 1.
Apoptosis level of Treg and Th17 cells in atherosclerosis (AS) and normal coronary arteries (NCA) group. (A) and (B) Representative flow cytometric dot plots for apoptotic Treg cells (gated by CD4+CD25+CD127- Annexin V+ cells) and apoptotic Th17 cells (gated by CD3+CD8-IL-17+ Annexin V+ cells) in each group; (C) A summary of the percentage of apoptotic Treg and Th17 cells in AS (n = 31) and NCA (n = 31) group. (** p < 0.01; ns, not significant)

