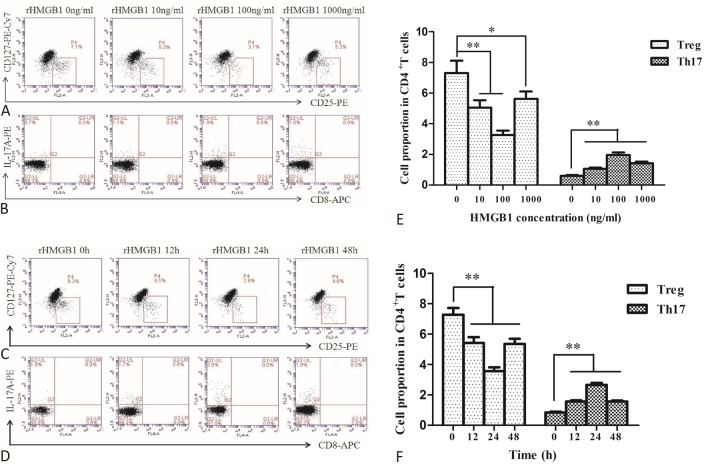
Figure 2.
Change of Treg and Th17 cell frequencies after rHMGB1 stimulation at various concentrations for 24 h (NCA, n = 8) and after 100 ng/mL rHMGB1 stimulation for different incubation times (NCA, n = 5). (A) and (B) Representative flow cytometric dot plots for Treg cells (gated by CD4+CD25+CD127- cells) and Th17 cells (gated by CD3+CD8-IL-17+ cells) after rHMGB1 stimulation at various concentrations; (C) and (D) Representative flow cytometric dot plots for Treg cells (gated byCD4+CD25+CD127- cells) and Th17 cells (gated by CD3+CD8-IL-17+ cells) after rHMGB1 stimulation for different incubation times; (E) Comparison of Treg and Th17 cell frequencies after rHMGB1 stimulation at various concentrations for 24 h; (F) Comparison of Treg and Th17 cell frequencies after 100 ng/mL rHMGB1 stimulation for different incubation times. (* p < 0.05, ** p < 0.01)

