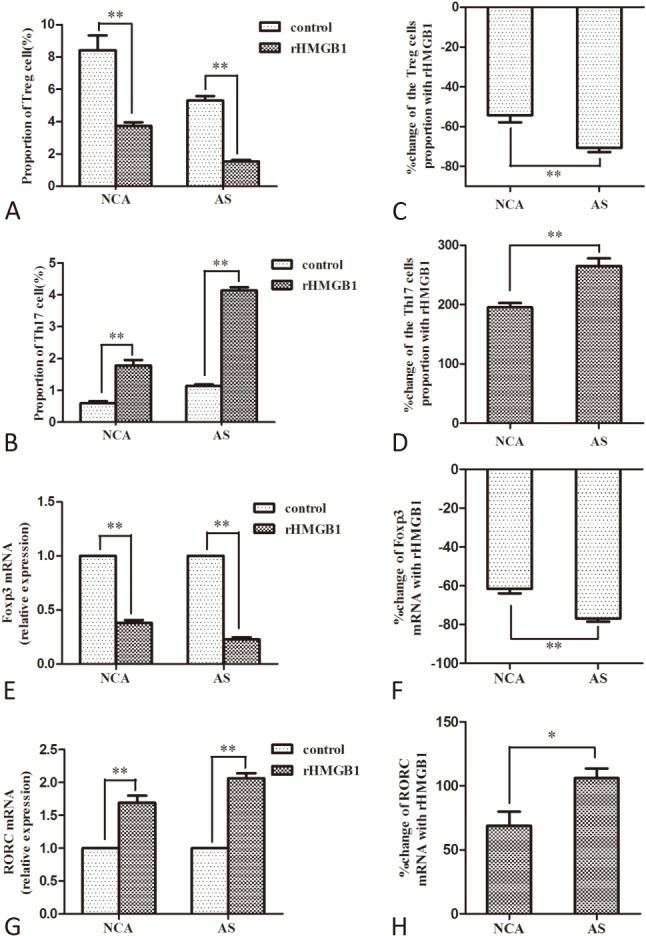
Figure 3.

Comparison of frequencies changes of Treg and Th17 cell and expression changes of Foxp3 and RORC mRNA induced by rHMGB1 in atherosclerosis (AS) and normal coronary arteries (NCA) group (AS, n = 5; NCA, n = 5). (A) and (B) Comparison of Treg and Th17 cell frequencies with or without 100 ng/mL rHMGB1 stimulation for 24 h in each group; (C) and (D) Average change of Treg and Th17 cell numbers in two groups after rHMGB1 stimulation; (E) and (F) Comparison of Foxp3 and RORC mRNA levels with or without 100 ng/mL rHMGB1 stimulation for 24 h in each group; (G) and (H) Average change of Foxp3 and RORC mRNA levels in two groups after rHMGB1 stimulation. (* p < 0.05, ** p < 0.01)
