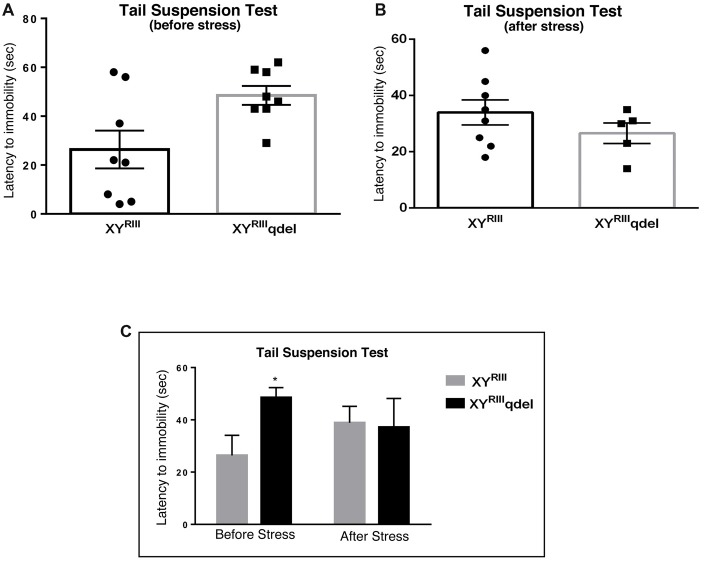
Figure 4.
The latency to immobility in XYRIIIqdel and XYRIII mice was evaluated by tail suspension test before and after the exposure of the stressors. Before the mice have undergone stress paradigm, XYRIIIqdel exhibited significant hyperactivity by showing remarkably more time in attaining first time immobility (A,C). Please notice after stress this hyperactivity was leveled as shown by scatter bar plot (B) of the latency. Combined bar graph is shown to compare the effect of before and after stress in latency (C). Data are expressed as the mean ± SEM, *P < 0.05, n = 8–10 per group in before stress, n = 6–8 per group in after stress experiments.

