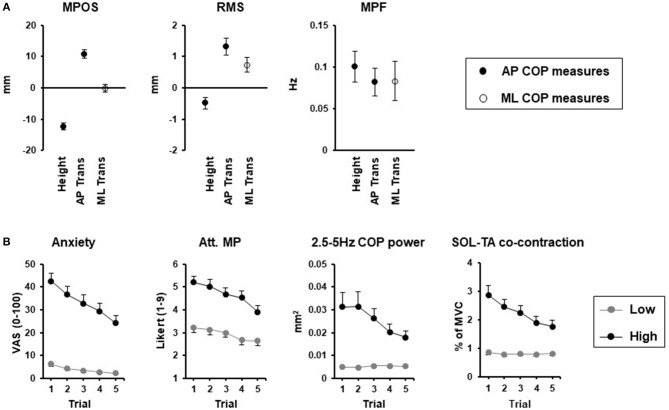
Figure 1.
Threat context (A) and adaptation (B) effects. (A) Change in center of pressure (COP) mean position (MP), mean power frequency (MPF), and root mean square (RMS) between threat and no threat conditions for height, [0.8 and 3.2 m surface; 60-s stance duration; modified from (34)] and support surface translations (Trans) in the anterior-posterior (AP) direction [30 s stance duration; modified from (75)] and medial-lateral (ML) direction [60-s stance duration; (76)]. Closed circles reflect AP COP measures while open circles reflect ML COP measures. (B) Adaptation of emotional, cognitive (attention focus to movement processes; Att. MP) and postural responses for low (gray circles) and high (black circles) surface heights over 5 repeated 120-s standing trials (77).

