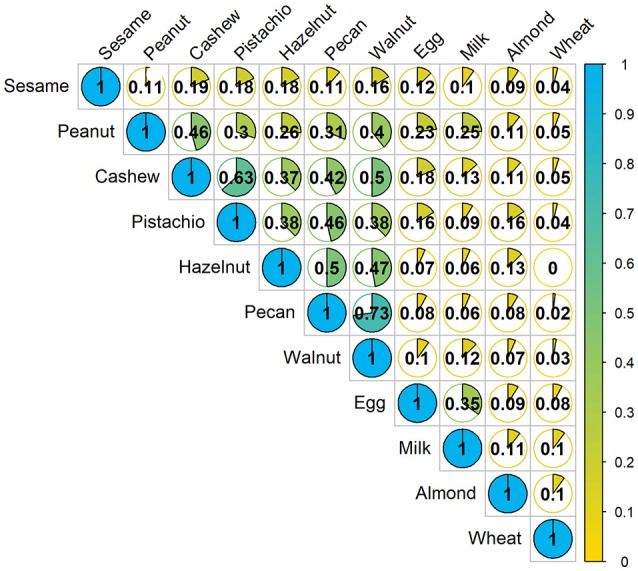
Figure 2.

Concurrent occurrences of food allergy based on food challenge outcomes: The fraction in each cell represents the Jaccard similarity coefficient, which is the amount of co-allergy accounting for the number of positive challenges for each allergen separately. Higher values indicate more similarity between the two allergens. Denominator only includes participants who were screened for multi-food allergy studies.
