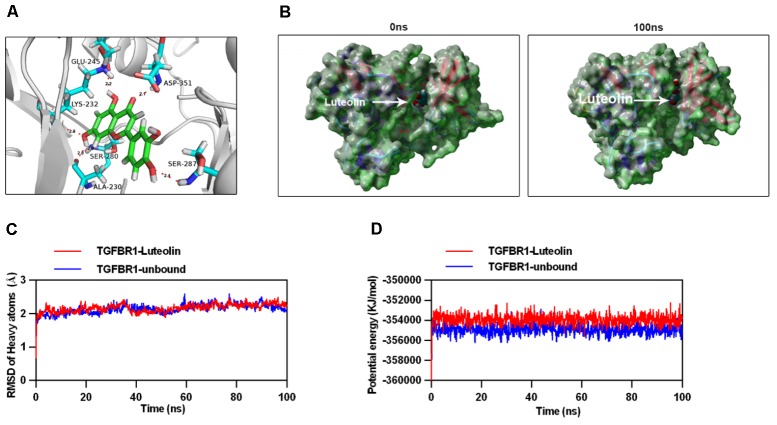
FIGURE 7.
Molecular docking and simulation of the molecular dynamics. (A) Three-dimensional crystal structure of luteolin (ZINC18185774) in complex with TGFBR1 (PDB ID: 1PY5). Luteolin is shown in green, and the hydrogen bonds are indicated by sky-blue lines. (B) Surface presentation of the TGFBR1-luteolin complex crystal structure at 0 and 100 ns. (C) Plots of root mean square deviation (RMSD) of heavy atoms of TGFBR1 unbound (blue) and TGFBR1-luteolin complex (red). (D) Potential energy profiles of TGFBR1-free (blue) and TGFBR1-luteolin complex (red) during the 100-ns molecular dynamics simulation.

