Figure 3.
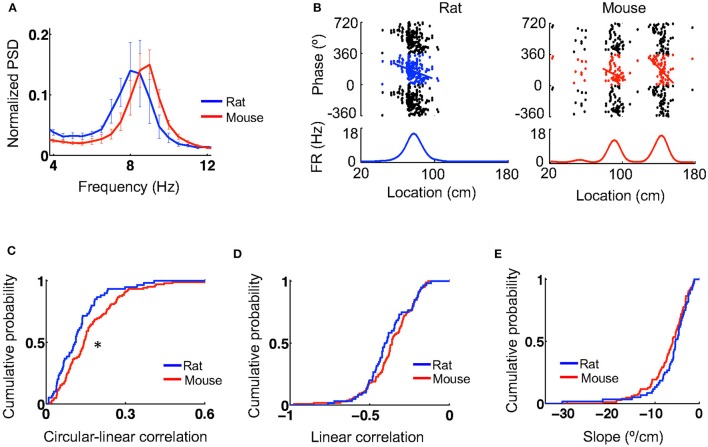
Theta oscillations and theta phase precession were similar between mice and rats. (A) Average (mean and s.e.) power spectral densities (PSDs) of mouse and rat CA1 LFPs. The PSDs were normalized by the total power within [2,400] Hz. (B) Theta phase precession of the same example cells in Figure 1A. In each panel, the top shows spike phases plotted against their locations on the track. The same spikes were plotted for 3 cycles of circular phases. Line: optimal linear regression between spike phases and locations. The bottom shows the firing rate curve of the cell. (C–E) Cumulative distributions of circulation-linear correlation (C), optimal linear correlation (D), and associated slope (E) between spike phases and spike locations for rat and mouse place cells on the novel track. *P < 0.05.

