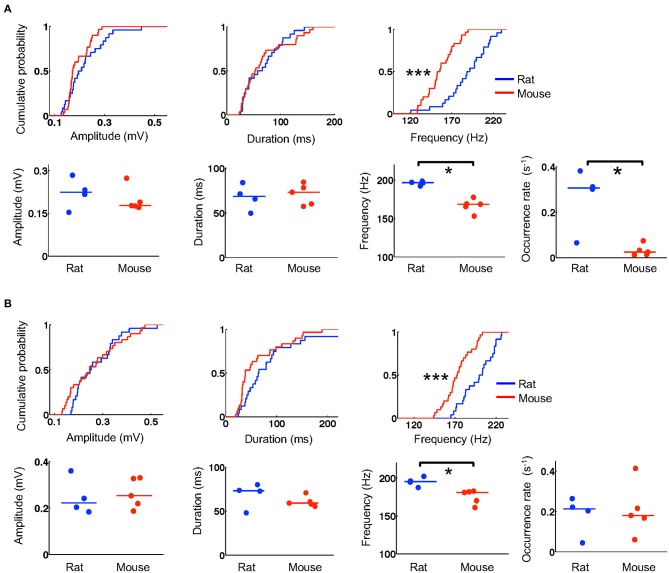
Figure 5.
Mouse ripples had lower frequencies. (A) Quantifications of ripple parameters (amplitude, duration, frequency, occurrence rate) during stopping on the novel track. For each column, the top shows the cumulative distribution of a parameter computed from individual ripples sampled equally from all animals in the rat and mouse group (N = 24 ripples from 4 rats, 30 ripples from 5 mice; 6 ripples per animal). The bottom shows the parameter's values for individual animals averaged from all ripples detected on the track. Lines: median values. *P < 0.05, ***P < 0.001. (B) Same as in (A), but for ripples during resting in a box after the track running.

