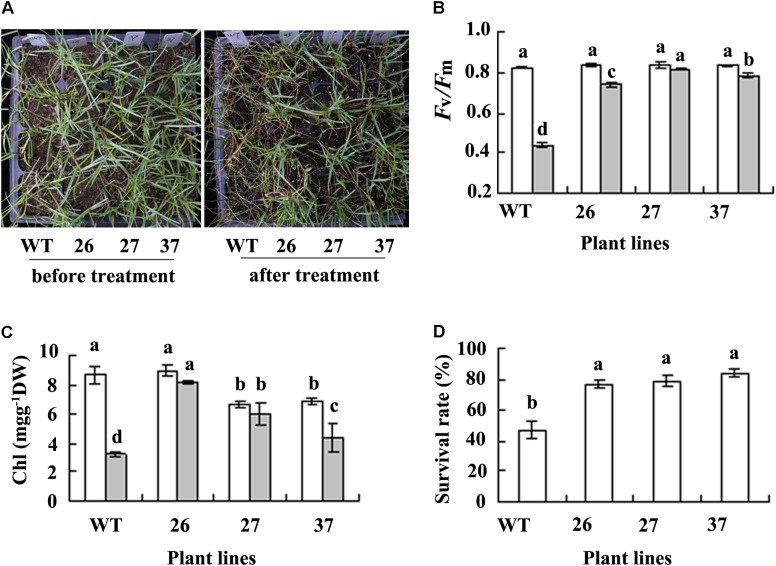
FIGURE 3.
Analysis of salt tolerance in transgenic plants in comparison with the WT. Photography (A) was taken before salt treatment (left) and 7 days after watering to dilute slat as a result of treatment with 0.7 M NaCl (right), followed by recording survival plant numbers to calculate survival rate (D). Fv/Fm (B) and chlorophyll (Chl, C) were measured 4 days after NaCl concentration was increased to 0.7 M. Means of three replicates and standard errors are presented; the same letter above the column indicates no significant difference at P < 0.05.

