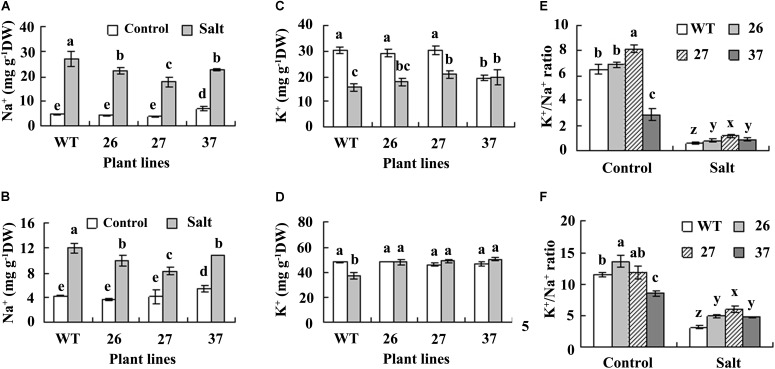
FIGURE 4.
Analysis of Na+, K+, and K+/Na+ ratio in roots (A,C,E) and leaves (B,D,F) of transgenic plants and the WT. Roots and leaves were sampled before treatment (control) and 4 days after NaCl concentration was increased to 0.7 M for measurement of Na+ and K+. Means of three independent experiments and standard errors are presented; the same letter above the column indicates no significant difference at P < 0.05.

