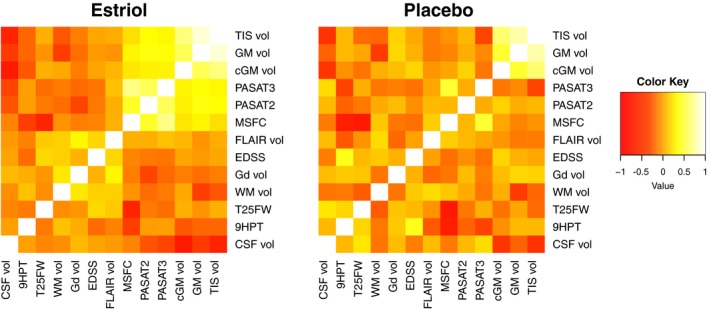
Figure 4.

Heat map showing positive and negative correlations and their clustering in each treatment group. A graphical representation of relationship among treatment‐induced sparing volume (TIS vol), traditional MRI measures (gray matter volume (GM vol), cortical gray matter volume (cGM vol), fluid‐attenuated inversion recovery lesion volume (FLAIR vol), gadolinium‐enhancing lesion volume (Gd vol), white matter volume (WM vol), cerebrospinal fluid volume (CSF vol)), and clinical measures (paced auditory serial addition test at 3 s (PASAT3), paced auditory serial addition test at 2 s (PASAT2), timed 25‐foot walk (T25FW), nine‐hole peg test (9HPT), multiple sclerosis functional composite (MSFC), expended disability status score (EDSS)). In the heat map, yellow indicates a positive (direct) correlation and red indicates a negative (indirect) correlation between the values. (a) Heat map for the estriol + glatiramer acetate group. (b) Heat map for the placebo + glatiramer acetate group
