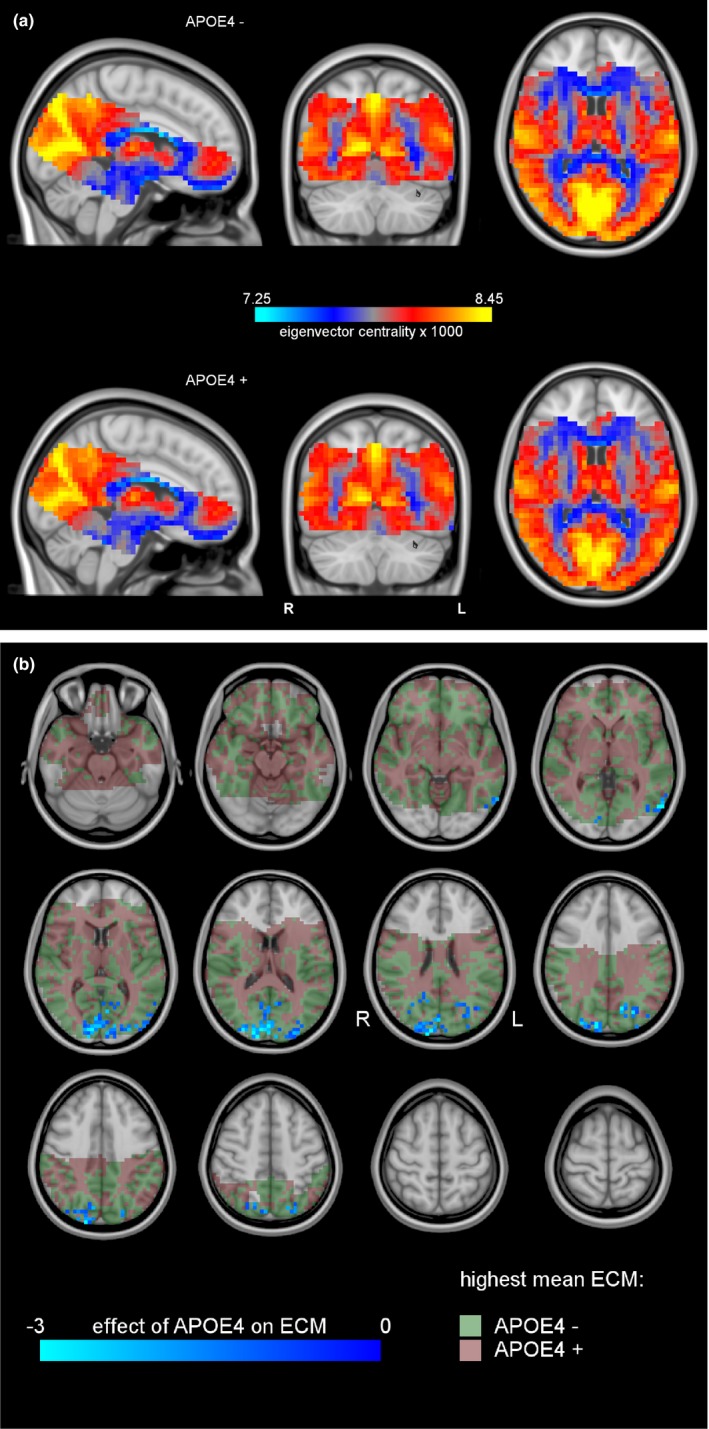
Figure 1.

(a) Group mean ECM for the APOE4− group (top) and the APOE4+ group (bottom). Centralities could only be computed in brain regions that were scanned in every subject (colored part). Blue indicates relatively low centralities, and yellow indicates high centralities. The occipital region indicated by the green arrow has visibly higher voxelwise centralities in the low‐risk group than in the high‐risk group. (b) Cluster of significant ECM differences between the APOE4− and APOE4+ groups (blue). The anatomical background is shown in gray scales. Areas where the mean centrality is highest in the APOE4+ group are in red, and areas where the mean centrality was highest in the APOE4− group are in green
