Figure 2.

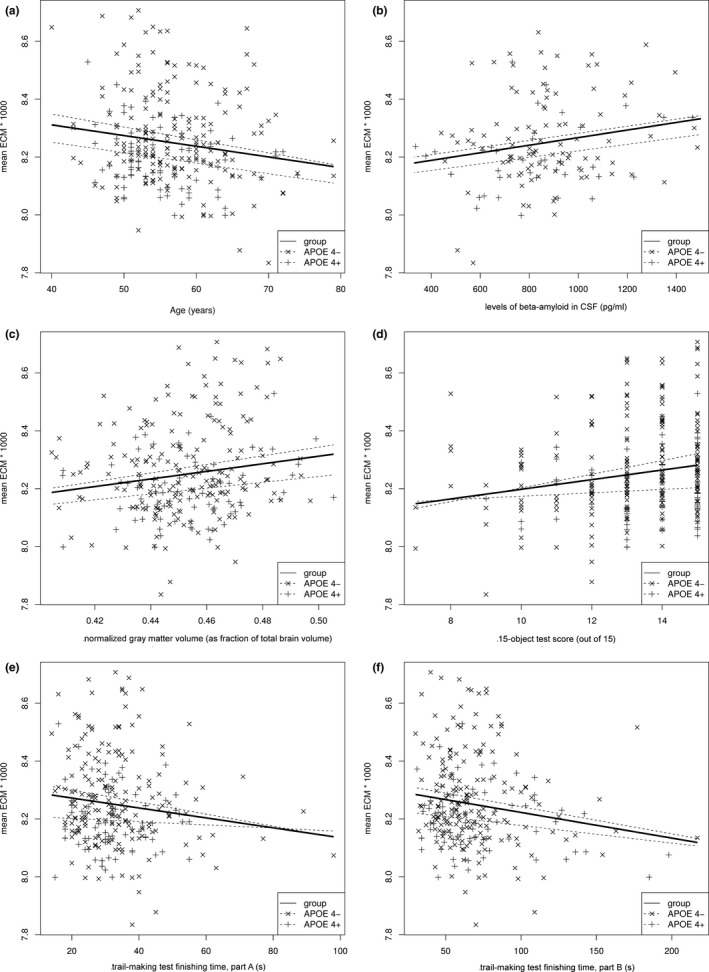
Cluster mean EC of all subjects plotted against subject age (a), CSF amyloid levels (b), NGMV (c), 15‐object test score (15OT) (d), and time to complete the trail‐making test (TMT) part A (e) and part B (f)

Cluster mean EC of all subjects plotted against subject age (a), CSF amyloid levels (b), NGMV (c), 15‐object test score (15OT) (d), and time to complete the trail‐making test (TMT) part A (e) and part B (f)