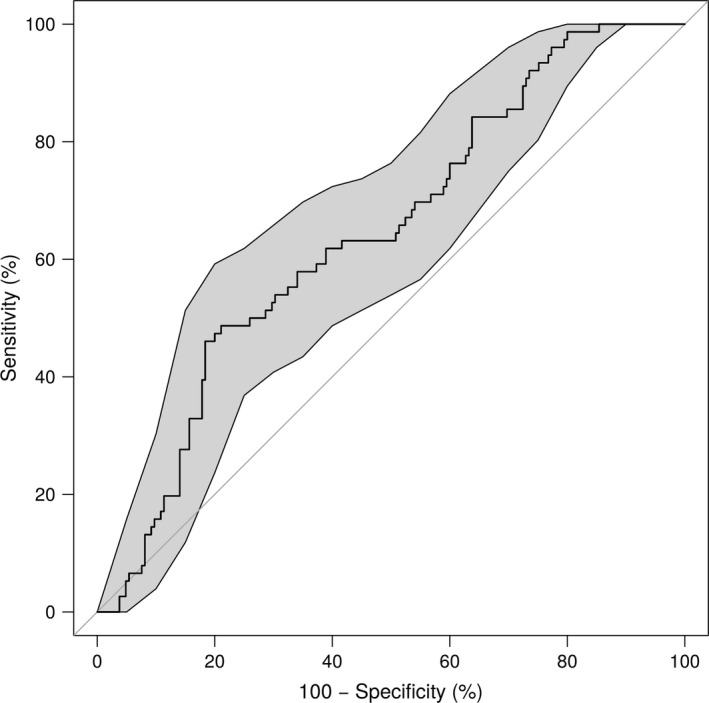
Figure 3.

Receiver operating curve (ROC) for predicting the APOE risk group with a logistic regression, using the mean ECM in the cluster of between‐group differences (see Figure 2b) as the main predictor and age and 15‐object test scores as covariates. The shaded areas are the 95% confidence intervals. The area under the curve (AUC) measured with this model was 64.4%
