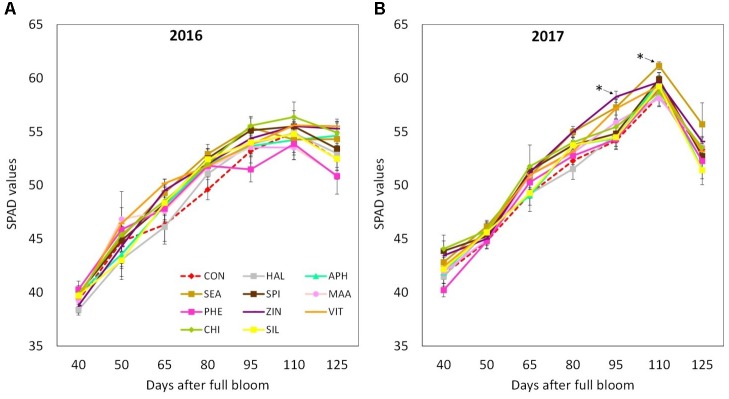
FIGURE 4.
Chlorophyll content (as SPAD values) dynamics (from 40 to 125 DAFB) in apple plants treated with different biostimulant products and water (control) for year 2016 (A) and 2017 (B). Vertical bars indicate mean ± SE, n = 4. ∗Indicates significant differences according to Dunnett’s test. ∗∗∗P < 0.001; ∗∗P < 0.01; ∗P < 0.05.

