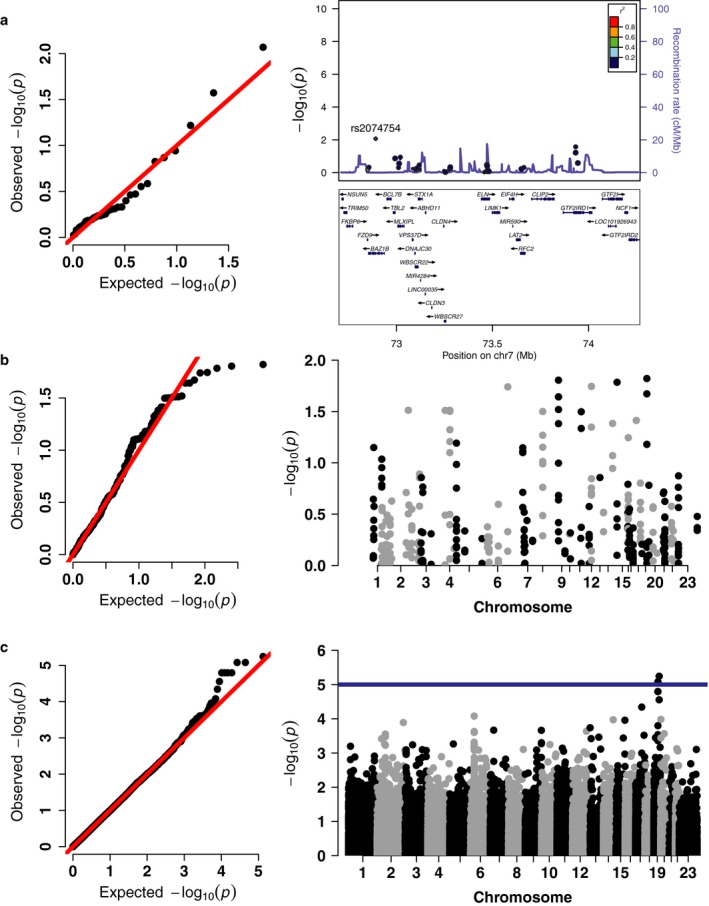
Figure 3.

Variants in the WSCR, ASD genes, or whole exome do not contribute to SRS variability in a sample of WS with typical deletions. (a) qq plot showing distribution of p‐values for common variants in the WSCR. Locus zoom plot showing the SNPs tested in the WSCR, highlighting the most nominally significant SNP in BAZ1B. (b) qq and manhattan plot for variants called in 71 genes associate with ASD from Sanders et al. (2015). (c) qq and manhattan plot for variants exome wide. Blue line demarcates a suggestive p value threshold of 1 × 10⁻⁵
