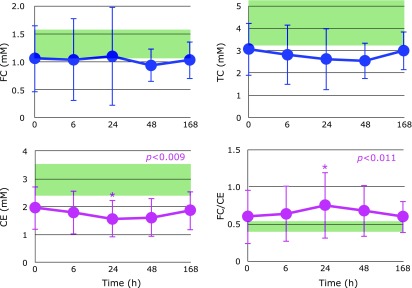
Fig. 3.
Time course of changes in plasma free cholesterol (FC), cholesterol esters (CE), total cholesterol (TC), and the FC/CE ratio after hospitalization. Range of average values ± SD in age-matched healthy controls is shaded in green. P values are indicated when one-way repeated measures ANOVA analysis was significant. *p<0.05, significant differences compared to values at 0 h as determined by Scheffe’s multiple comparison test.

