Figure 3.
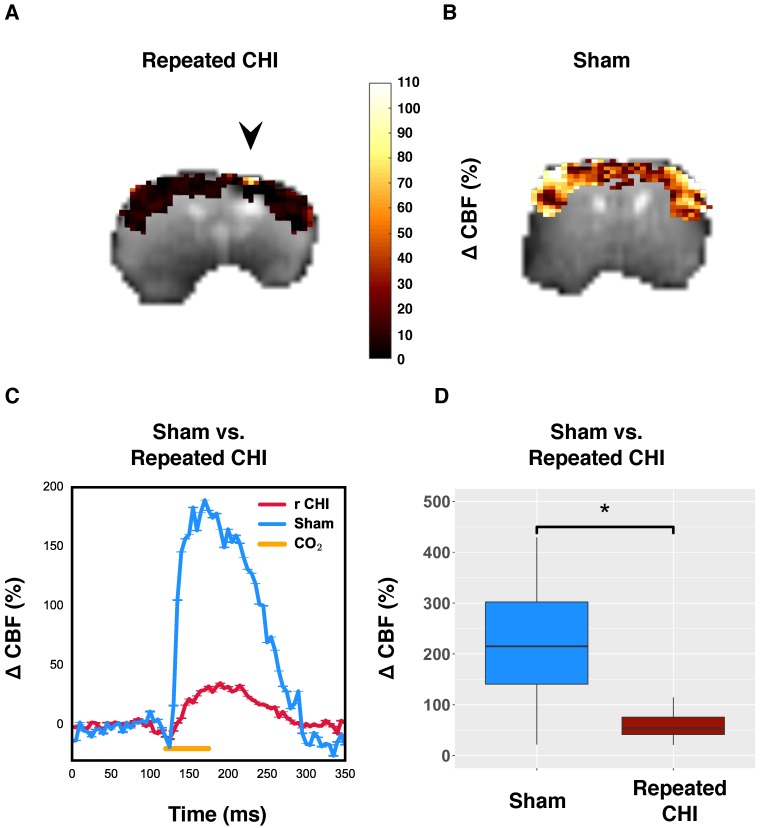
Reduced cerebrovascular reactivity to 10% inhaled CO2. (A) Map of percent change in CBF due to hypercapnic challenge in a representative repeated mTBI mouse, shown overlaid on the corresponding echo planar image with the site of impacts indicated by an arrow. (B) pCASL reactivity map for a representative sham-operated mouse. (C) Time-courses of mean response to CO2 for sham-treated and repeated mTBI mice. (D) Percent change in peri-contusional CBF in response to hypercapnia for representative sham and repeated mTBI mice. Injured mice showed reduced reactivity to hypercapnia (n=6) relative to sham-treated mice (n=5).

