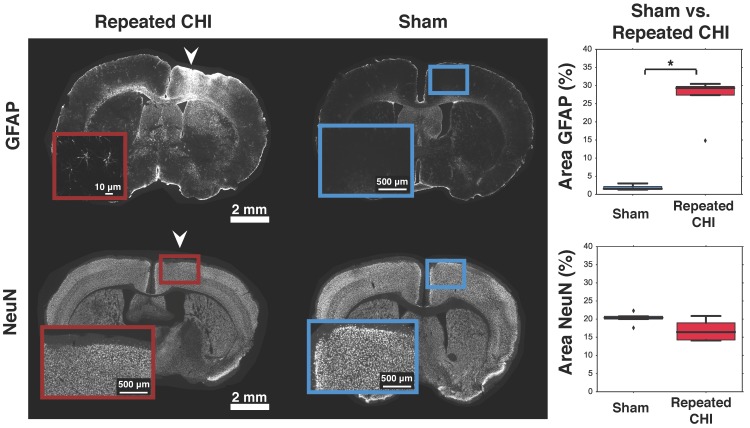
Figure 5.
Astrogliosis and neuronal survival. Brains were stained for GFAP (top) and NeuN (bottom). The left column shows slices from representative repeated CHI mice, while the middle column shows slices from sham-treated animals. Insets show the general cortical area below the skull location that was impacted, not the ROIs analyzed (the latter are displayed in Figure S2). For each stain, a box and whisker plot comparing optical density of peri-contusional tissue of repeated CHI (n=5, GFAP and NeuN) vs. sham-treated mice (n=5, GFAP and NeuN) is shown (right column). Top: GFAP stains of representative repeated mTBI (left) and sham (right) mice. GFAP fluorescence was elevated peri-contusionally relative to sham treated mice. No difference was observed in optical density of the peri-contusional tissue of NeuN-stained sections.

