Figure 5.
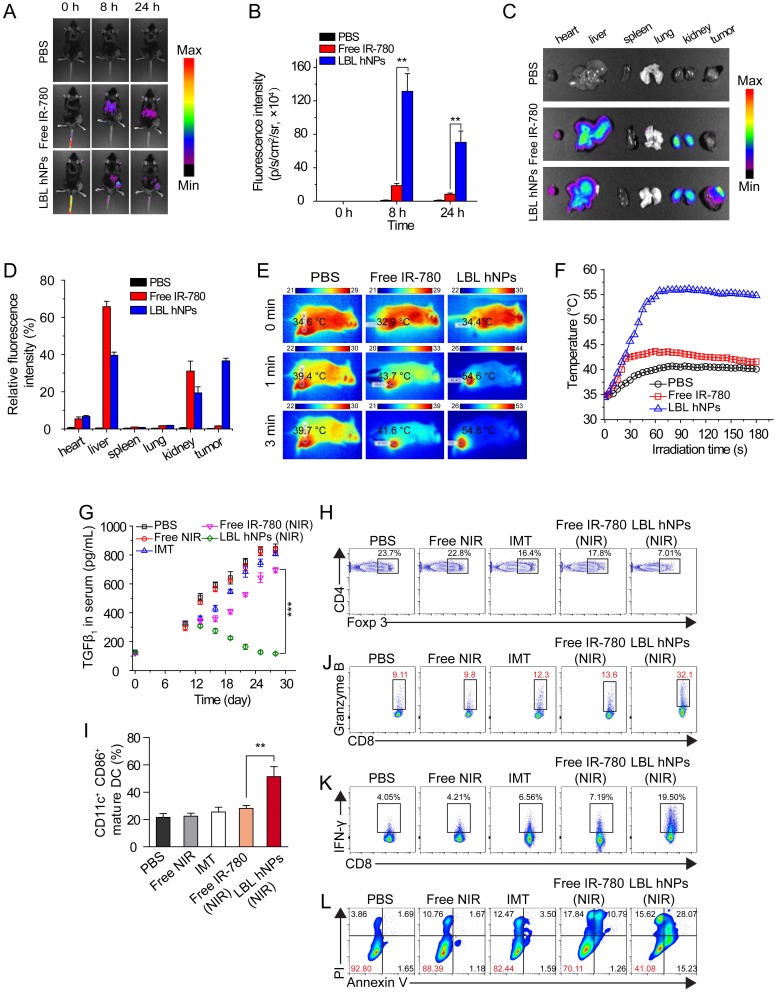
In vivo distribution, PTT effect, and immune-antitumor effect of LBL hNPs. (A) Fluorescence distribution in B16BL/6 tumor-bearing mice at 0, 8, and 24 h after intravenous administration of PBS, free IR-780 and LBL hNPs. (B) Mean fluorescence intensity in tumors in PBS, free IR-780 (8 mg/kg) and LBL hNPs treatment groups (n=3). **p < 0.01, one-way ANOVA. (C) Fluorescence distribution in the heart, liver, spleen, lungs, kidneys, and tumors after 24-h treatment with PBS, free IR-780 or LBL hNPs. (D) Relative fluorescence intensity percentage of these tissues after treatment with PBS, free IR-780 or LBL hNPs (n=3). (E-F) In vivo IR thermography and corresponding temperature increase at the tumors of mice injected with PBS, free IR-780, or LBL hNPs plus 3 min NIR irradiation (808 nm, 1.0 W/cm2). (G) Mean serum TGF-β levels in mice treated with PBS, NIR, IMT, free IR-780 (NIR), or LBL hNPs (NIR), at different days (n=6). ***p < 0.001, one-way ANOVA. (H) Intratumoral Treg cell percentages in mice treated with PBS, free NIR, IMT, free IR-780 (NIR), or LBL hNPs (NIR) at day 20 (n=6). (I) Intratumoral maturation of DCs in the indicated treatment groups (n=6). **p < 0.01, one-way ANOVA. (J-K) Secretion of antitumor cytokine Granzyme B and IFN-γ from intratumoral CD8+ T cells in the indicated treatment groups (n=6). (L) In vivo tumor cell apoptosis and necrosis in mice treated with PBS, NIR, IMT, free IR-780 (NIR), or LBL hNPs (NIR) (n=6).

