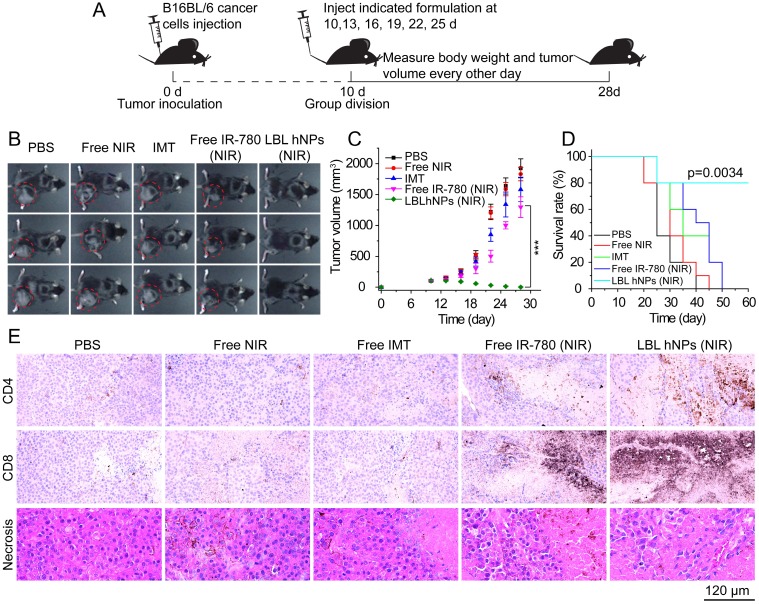
Figure 6.
In vivo tumor ablation and histopathological investigation. (A) In vivo antitumor therapy schedule for LBL hNPs administration. (B) Images of B16BL/6 tumor-bearing C57BL/6 mice taken at 28 days. (C) Average tumor growth curves for mice after indicated treatments. The intravenous injection began at day 10 after random group division (n=6). ***p < 0.001, one-way ANOVA. (D) Survival curves of mice after treatment with PBS, NIR, IMT, free IR-780 (NIR), or LBL hNPs (NIR) (n=5). Log-rank test. (E) Histopathological and immunohistochemical evaluation of intra-tumoral CD4+ T (Th) cells, CD8+ T cells, and tumor necrosis. Each tumor section was obtained from B16BL/6 tumor-bearing mice treated with PBS, NIR, IMT, free IR-780 (NIR), or LBL hNPs (NIR).

