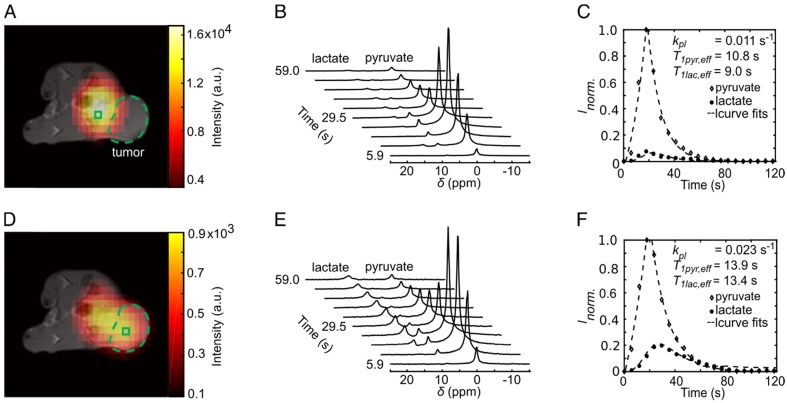
Figure 3.
Dynamic metabolic mapping of the LDH activity of subcutaneous MAT-B-III tumors using hyperpolarized pyruvate. (A) Static image of hyperpolarized pyruvate at pyruvate maximum in tissues surrounding the vena cava overlaid on an axial T1-weighted image. A non-tumor voxel is indicated with the green box, the tumor is delineated with the green dashed line. (B) Stacked plot of the first ten dynamic 13C-spectra of a non-tumor voxel from (A). (C) Dynamic series of pyruvate and lactate NMR signal integrals from (B) and normalized to the maximum integral of pyruvate (Inorm.). Curve fits are given with dashed lines. (D) Static image of hyperpolarized lactate at lactate maximum overlaid on an axial T1-weighted image. (E) Stacked plot of the first ten NMR spectra from a representative tumor voxel (green box in (D)). (F) Dynamic series of pyruvate and lactate NMR signal integrals of the tumor ROI and normalized to the maximum integral of pyruvate. Curve fits are given with dashed lines. Note that the pyruvate signal was about a factor of ten higher than that of lactate.

