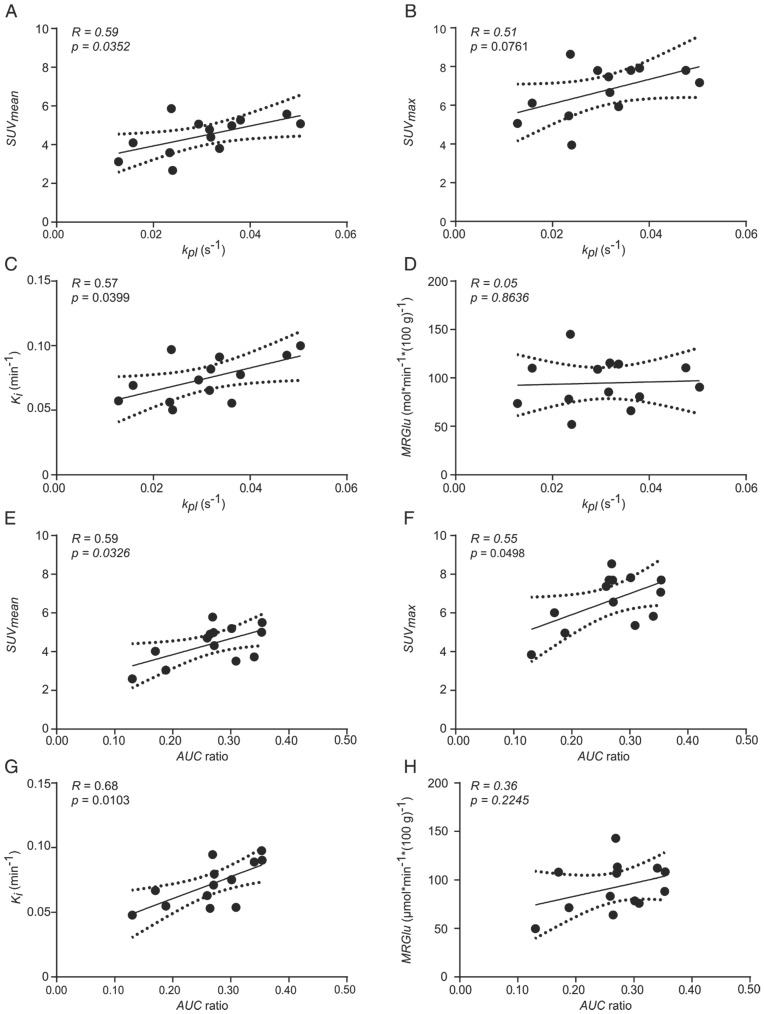
Figure 6.
Correlation plots of FDG uptake and hyperpolarized pyruvate CSI data of tumors with similar ADC values. Correlation of kpl with (A) SUVmean, (B) SUVmax, (C) Ki and (D) MRGlu. Correlation of AUC ratios with (E) SUVmean, (F) SUVmax, (G) Ki and (H) MRGlu. Best fit (solid line) and 95% confidence bands (dashed lines). The mean ADC of analyzed tumors was (0.57 ± 0.04)×10-3 mm2s-1 (n = 13).

